我想要绘制一个三维柱状图(使用gnuplot或者octave)来展示我的数据。假设我的数据文件如下所示:
我想绘制九个彩色条形图(矩阵的大小),在集合[1,3]x[1,3]中,使得条形图的颜色与其高度成比例。我该如何实现?
2 3 4
8 4 10
5 6 7
我想绘制九个彩色条形图(矩阵的大小),在集合[1,3]x[1,3]中,使得条形图的颜色与其高度成比例。我该如何实现?
bar3的替代品。patch对象绘制所有条形图,而不是每个条形图一个补丁(这在图形性能方面更有效)。XData、YData、ZData和CData属性来实现,而不是Vertices和Faces属性。事实上,这就是bar3内部所做的。这种方法通常需要更大的数据来定义补丁(因为我们不能在补丁面之间共享点,尽管我在我的实现中并不太关心这一点)。在这里,我试图解释由bar3构建的数据结构的相关帖子。
function pp = my_bar3(M, width)
    % MY_BAR3  3D bar graph.
    %
    % M     - 2D matrix
    % width - bar width (1 means no separation between bars)
    %
    % See also: bar3, hist3

    %% construct patch
    if nargin < 2, width = 0.8; end
    assert(ismatrix(M), 'Matrix expected.')

    % size of matrix
    [ny,nx] = size(M);

    % first we build a "template" column-bar (8 vertices and 6 faces)
    % (bar is initially centered at position (1,1) with width=? and height=1)
    hw = width / 2;    % half width
    [X,Y,Z] = ndgrid([1-hw 1+hw], [1-hw 1+hw], [0 1]);
    v = [X(:) Y(:) Z(:)];
    f = [
        1 2 4 3 ; % bottom
        5 6 8 7 ; % top
        1 2 6 5 ; % front
        3 4 8 7 ; % back
        1 5 7 3 ; % left
        2 6 8 4   % right
    ];

    % replicate vertices of "template" to form nx*ny bars
    [offsetX,offsetY] = meshgrid(0:nx-1,0:ny-1);
    offset = [offsetX(:) offsetY(:)]; offset(:,3) = 0;
    v = bsxfun(@plus, v, permute(offset,[3 2 1]));
    v = reshape(permute(v,[2 1 3]), 3,[]).';

    % adjust bar heights to be equal to matrix values
    v(:,3) = v(:,3) .* kron(M(:), ones(8,1));

    % replicate faces of "template" to form nx*ny bars
    increments = 0:8:8*(nx*ny-1);
    f = bsxfun(@plus, f, permute(increments,[1 3 2]));
    f = reshape(permute(f,[2 1 3]), 4,[]).';

    %% plot
    % prepare plot
    if exist('OCTAVE_VERSION','builtin') > 0
        % If running Octave, select OpenGL backend, gnuplot wont work
        graphics_toolkit('fltk');
        hax = gca;
    else
        hax = newplot();
        set(ancestor(hax,'figure'), 'Renderer','opengl')
    end


    % draw patch specified by faces/vertices
    % (we use a solid color for all faces)
    p = patch('Faces',f, 'Vertices',v, ...
        'FaceColor',[0.75 0.85 0.95], 'EdgeColor','k', 'Parent',hax);
    view(hax,3); grid(hax,'on');
    set(hax, 'XTick',1:nx, 'YTick',1:ny, 'Box','off', 'YDir','reverse', ...
        'PlotBoxAspectRatio',[1 1 (sqrt(5)-1)/2]) % 1/GR (GR: golden ratio)

    % return handle to patch object if requested
    if nargout > 0
        pp = p;
    end
end
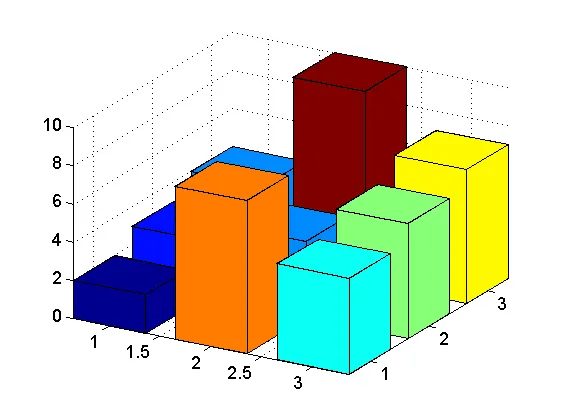
这是一个示例,用于与MATLAB中内置的bar3函数进行比较:
subplot(121), bar3(magic(7)), axis tight
subplot(122), my_bar3(magic(7)), axis tight
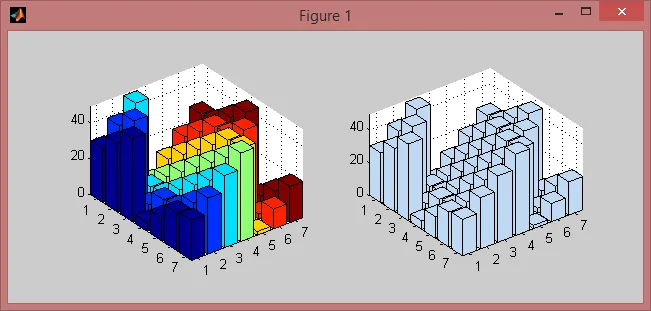
hist3函数的输出),而MATLAB则强调使用匹配颜色的矩阵列。bar3 着色模式:M = membrane(1); M = M(1:3:end,1:3:end);
h = my_bar3(M, 1.0);
% 6 faces per bar
fvcd = kron((1:numel(M))', ones(6,1));
set(h, 'FaceVertexCData',fvcd, 'FaceColor','flat', 'CDataMapping','scaled')
colormap hsv; axis tight; view(50,25)
set(h, 'FaceAlpha',0.85) % semi-transparent bars
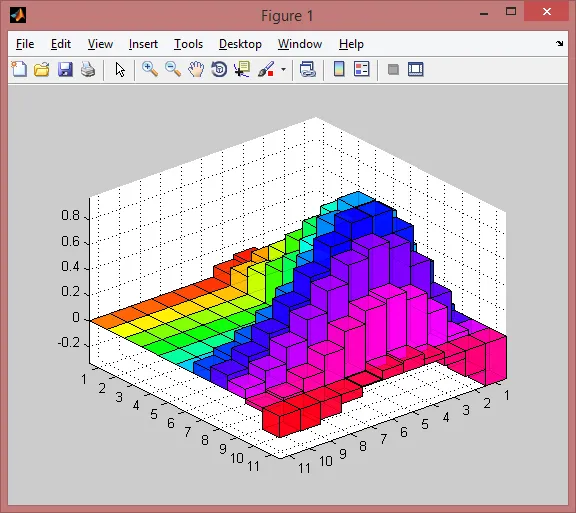
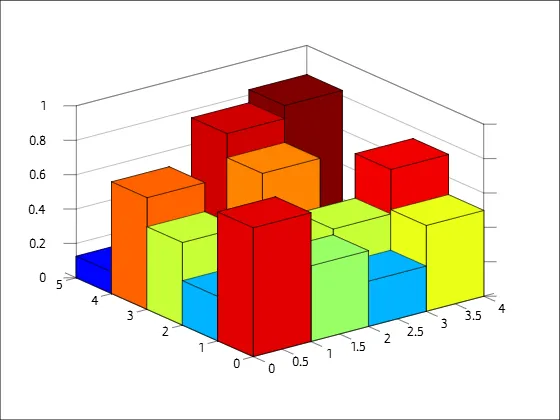
假设你想要根据柱子的高度使用渐变来着色:
M = 9^2 - spiral(9);
h = my_bar3(M, 0.8);

% use Z-coordinates as vertex colors (indexed color mapping)
v = get(h, 'Vertices');
fvcd = v(:,3);
set(h, 'FaceVertexCData',fvcd, 'FaceColor','interp')

axis tight vis3d; daspect([1 1 10]); view(-40,20)
set(h, 'EdgeColor','k', 'EdgeAlpha',0.1)
colorbar穿过jet调色板,而不是从底部蓝色到定义高度处的任何颜色的渐变,如上所示)。有关更多详细信息,请参见此帖子。
membrane和spiral来构建样本矩阵,但这些对代码不是必需的,只需用您自己的数据替换它们即可 :)
my_bar3(Z,C) 的形式调用函数,其中 C(与 Z 大小相同的矩阵)用于着色条形图?我想这是可以做到的,但是 bar3(我试图复制它)没有提供这样的语法。此外,我不想处理所有可能的调用选项,因为这会使代码变得太长(我们必须检查是否传递了 C,如果缺少,我们是否假定 C=Z,还是应该为所有条形图使用单一颜色?此外,决定是否应将 C 用于指定渐变或用于具有纯色的条形图)。至少在示例中,我展示了如何完成其中的一些内容 :) - Amromy_bar3(Z, width, C) 这样,这样它仍然可以像 bar3 一样使用。我认为默认的 C 可以是一个纯色,就像你现在创建的函数一样。我没有真正考虑渐变与纯色问题... - Dan本解决方案仅使用OCTAVE中可用的功能,在octave-online上经过测试。
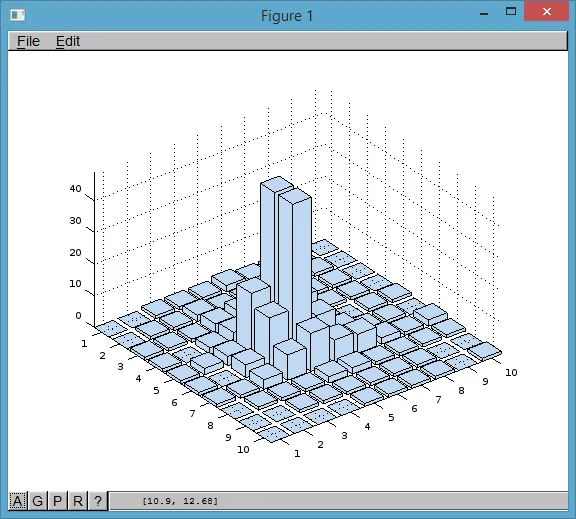
此解决方案以类似于Matlab hist3d函数内部的方式生成表面。
简而言之:
对于包含bin高度(代码中的bin_values)的矩阵给出的数据:
代码:
bin_values=rand(5,4); %some random data

bin_edges_x=[0:size(bin_values,2)];
x=kron(bin_edges_x,ones(1,5));
x=x(4:end-2);

bin_edges_y=[0:size(bin_values,1)];
y=kron(bin_edges_y,ones(1,5));
y=y(4:end-2);

mask_z=[0,0,0,0,0;0,1,1,0,0;0,1,1,0,0;0,0,0,0,0;0,0,0,0,0];
mask_c=ones(5);
z=kron(bin_values,mask_z);
c=kron(bin_values,mask_c);

surf(x,y,z,c)
输出
我没有使用Octave的权限,但是我相信以下代码可以解决问题:
Z = [2 3 4
     8 4 10
     5 6 7];

[H W] = size(Z);

h = zeros( 1, numel(Z) );
ih = 1;
for ix = 1:W
    fx = ix-.45;
    tx = ix+.45;
    for iy = 1:W
        fy = iy-.45;
        ty = iy+.45;

        vert = [ fx fy 0;...
            fx ty 0;...
            tx fy 0;...
            tx ty 0;...
            fx fy Z(iy,ix);...
            fx ty Z(iy,ix);...
            tx fy Z(iy,ix);...
            tx ty Z(iy,ix)];
        faces = [ 1 3 5;...
            5 3 7;...
            7 3 4;...
            7 8 4;...
            5 6 7;...
            6 7 8;...
            1 2 5;...
            5 6 2;...
            2 4 8;...
            2 6 8];

        h(ih) = patch( 'faces', faces, 'vertices', vert, 'FaceVertexCData', Z(iy,ix),...
            'FaceColor', 'flat', 'EdgeColor','none' );
        ih = ih+1;
    end
end
view( 60, 45 );
colorbar;
faces的一行)在vert中索引了三行。因此,面[1 3 5]是连接第一个、第三个和第五个顶点的三角形。 - Shaicolormap、surf和patch更复杂的内容,据我所知这些内容在Octave中应该都可以直接使用。%# Your data
Z = [2 3 4
8 4 10
5 6 7];
%# the "nominal" bar (adjusted from cylinder())
n = 4;
r = [0.5; 0.5];
m = length(r);
theta = (0:n)/n*2*pi + pi/4;
sintheta = sin(theta); sintheta(end) = sqrt(2)/2;
x0 = r * cos(theta);
y0 = r * sintheta;
z0 = (0:m-1)'/(m-1) * ones(1,n+1);
%# get data for current colormap
map = colormap;
Mz = max(Z(:));
mz = min(Z(:));
% Each "bar" is 1 surf and 1 patch
for ii = 1:size(Z,1)
for jj = 1:size(Z,2)
% Get color (linear interpolation through current colormap)
cI = (Z(ii,jj)-mz)*(size(map,1)-1)/(Mz-mz) + 1;
fC = floor(cI);
cC = ceil(cI);
color = map(fC,:) + (map(cC,:) - map(fC,:)) * (cI-fC);
% Translate and rescale the nominal bar
x = x0+ii;
y = y0+jj;
z = z0*Z(ii,jj);
% Draw the bar
surf(x,y,z, 'Facecolor', color)
patch(x(end,:), y(end,:), z(end,:), color)
end
end
结果:
我如何生成“名义条形图”是基于MATLAB的cylinder()代码。这个方法很酷的一点是你可以非常容易地制作出更加炫酷的条形图:
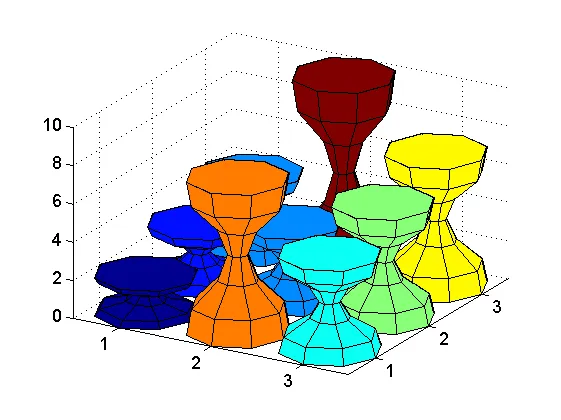
通过改变参数,可以生成上述效果。
n = 4;
r = [0.5; 0.5];
转换为
n = 8;
r = [0.5; 0.45; 0.2; 0.1; 0.2; 0.45; 0.5];
surf、patch或者colormap会以你所描述的方式失败... - Rody Oldenhuissurface 的调用之间使用 hold on。最终结果是只绘制了最后一个条形图。 - carandraug您看过这篇关于bar3的教程了吗?
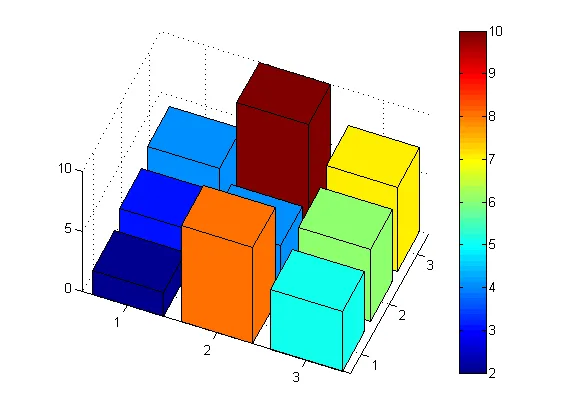
稍作修改:
Z=[2 3 4
   8 4 10
   5 6 7]; % input data
figure;
h = bar3(Z); % get handle to graphics
for k=1:numel(h),
    z=get(h(k),'ZData'); % old data - need for its NaN pattern
    nn = isnan(z);
    nz = kron( Z(:,k),ones(6,4) ); % map color to height 6 faces per data point
    nz(nn) = NaN; % used saved NaN pattern for transparent faces
    set(h(k),'CData', nz); % set the new colors
end
colorbar;
最终你将会得到以下内容:
bar3 :( - Dan我想提出一个灵感来自Scilab和Matlab的解决方案。对于颜色,我使用了Oldenhuis在这个页面上展示的代码。
clear -a;
data=[2,3,4;8,4,10;5,6,7];
[nr,nc]=size(data);
m=min(data(:));
M=max(data(:));
w=0.8;
cmap=colormap(jet);

figure(1);
clf;
hold on;
for i=1:nr
    for j=1:nc
        x=[zeros(2,1)+j+(1-w),ones(2,2)*w+j,zeros(2,2)+j+(1-w)];
        y=[zeros(2,2)+i+(1-w),ones(2,2)*w+i,zeros(2,1)+i+(1-w)];
        z=[zeros(1,5);ones(1,5)*data(i,j)];
        index=(data(i,j)-m)*(size(cmap,1)-1)/(M-m)+1;
        f=floor(index);
        c=ceil(index);
        color=cmap(f,:)+(cmap(c,:)-cmap(f,:))*(index-f);
        surf(x,y,z,"facecolor",color,"facealpha",1,"linewidth",0.1);
        patch(x',y',z',color,"facealpha",1,"linewidth",0.1);
    end
end

view(160,30);
xlabel("X label");
ylabel("Y label");
zlabel("Z label");
title("Title");
set(gca,"xtick",1.5:1:3.5,"xticklabel",{"3","2","1"});
set(gca,"ytick",1.5:1:3.5,"yticklabel",{"C","B","A"});
grid on;
hold off;

print -dpng plot_bar3d_test.png
结果是最终的图表。
interp2和最近邻插值来将数据从3x3重采样到300x300,然后只需使用surf,您觉得如何? - Dan