我正在绘制数据,如之前在Stackoverflow中描述的那样:
gnuplot 2D极坐标热力图 - 可行吗?
它对我大部分工作都很好,现在只有一些小问题需要解决。其中一个问题是如何控制等高线的颜色和线宽。网上有很多关于使用
接下来,我重新启动了gnuplot,在不重新定义任何线样式或类型的情况下生成了绘图。当我查看我的绘图时,我可以看到线的颜色从青色开始,然后是紫色,然后是蓝色(例如像线型5,4,3或14,13,12等)。似乎线型通过可用的样式向后走。好吧,我想,我可以改变它们并接受奇怪的行为。然而,在发出多个set linetype命令以将所有这些线型更改为明显不同的内容之后(我通过运行
也许这种奇怪的行为是等高线类型
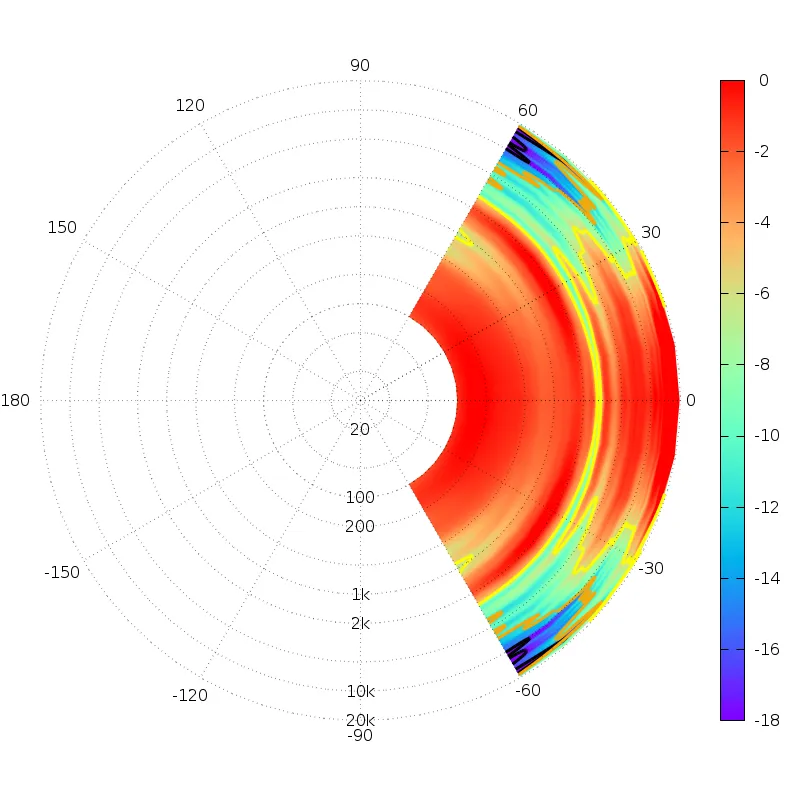
我想知道如何知道在这个绘图中将使用什么线型,并且如果用于构建表面绘图的线条数目发生变化,这是否会改变。例如,下面显示的绘图使用13条“线”使用
底线是,我需要为每个等高线层应用特定的样式。当输入数据更改时,我希望每个等级都能保持一致的样式。图表将始终使用相同的等高线值:-6、-12、-18 和 -24。图表数据始终具有大约 0 的最大“z”坐标,并从那里递减。
以下是 Gnuplot 命令。此图的数据集可在此下载:http://audio.claub.net/temp/new_test.dat
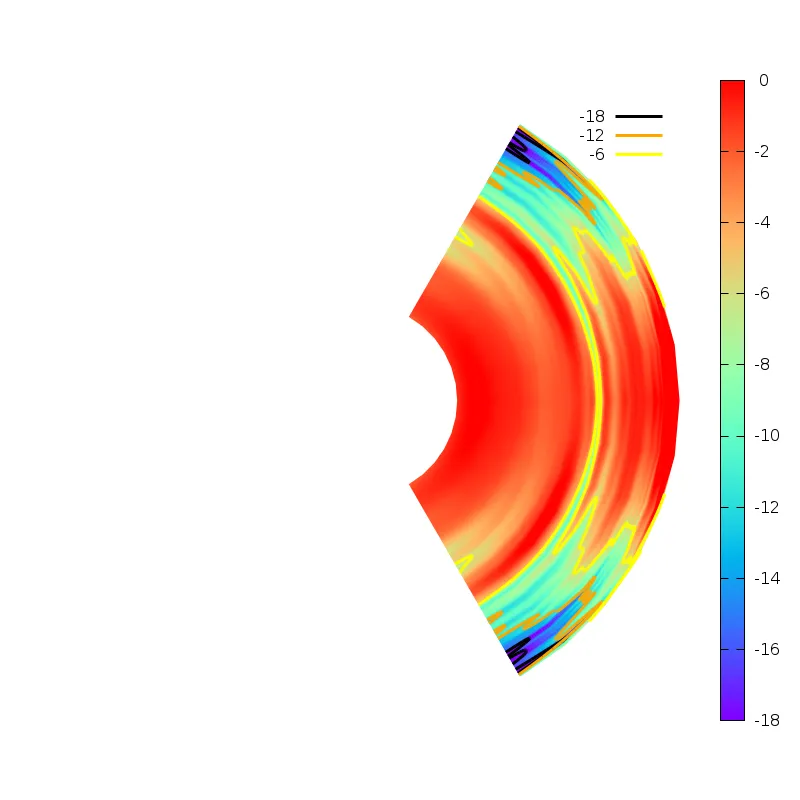
下面展示了没有对等高线控制的绘图。我需要能够指定等高线的线条颜色和宽度。如何做到?
set style increment user后跟通过set style line 1 lc rgb "blue" lw 2定义用户样式的文章。理论上,这应该强制splot使用新定义的样式来绘制线条。我尝试过,但没有效果。另外,当我通过我的gnuplot安装访问帮助页面时,我发现这种用法已经被废弃了(版本为4.7,补丁级别为0,最后修改于2013-07-25)。建议使用set linetype代替,这将永久地更改当前调用gnuplot的gnuplot线条样式的特性。关闭并重新启动gnuplot将还原默认的linetype特性。接下来,我重新启动了gnuplot,在不重新定义任何线样式或类型的情况下生成了绘图。当我查看我的绘图时,我可以看到线的颜色从青色开始,然后是紫色,然后是蓝色(例如像线型5,4,3或14,13,12等)。似乎线型通过可用的样式向后走。好吧,我想,我可以改变它们并接受奇怪的行为。然而,在发出多个set linetype命令以将所有这些线型更改为明显不同的内容之后(我通过运行
test命令验证了这些),图中的等高线仍然具有与之前相同的颜色和线宽。我似乎无法弄清楚等高线正在使用哪种线型,因此无法更改适当的线型。也许这种奇怪的行为是等高线类型
set cntrparam levels increment -6,-6,-24的结果,负值和/或负增量导致了一些不可预测的行为?我想知道如何知道在这个绘图中将使用什么线型,并且如果用于构建表面绘图的线条数目发生变化,这是否会改变。例如,下面显示的绘图使用13条“线”使用
set pm3d map生成表面。所以假设N=13条线 - 是否有一个规则遵守第一个等高线类型?例如,我是否总是确定等高线样式将从N=14开始?我想知道当输入数据的“线”数目变化时,第一个和后续等高线将使用什么线型。底线是,我需要为每个等高线层应用特定的样式。当输入数据更改时,我希望每个等级都能保持一致的样式。图表将始终使用相同的等高线值:-6、-12、-18 和 -24。图表数据始终具有大约 0 的最大“z”坐标,并从那里递减。
以下是 Gnuplot 命令。此图的数据集可在此下载:http://audio.claub.net/temp/new_test.dat
reset
set terminal pngcairo size 800,800
set output '3d-polar.png'

set lmargin at screen 0.05
set rmargin at screen 0.85
set bmargin at screen 0.1
set tmargin at screen 0.9

set pm3d map interpolate 20,20
unset key

set multiplot

# plot the heatmap

set cntrparam bspline
set cntrparam points 10
set cntrparam levels increment -6,-6,-24
set contour surface
#set style increment user           #NOTE: the commented out lines do not seem to affect color or width of the the contour lines no matter what number I use for the linetype
#set linetype 8 lc rgb "blue" lw 2
#set linetype 9 lc rgb "black" lw 1
#set linetype 10 lc rgb "orange" lw 1
#set linetype 11 lc rgb "yellow" lw 1

set palette rgb 33,13,10 #rainbow (blue-green-yellow-red)
set cbrange [-18:0]

unset border
unset xtics
unset ytics

set angles degree
r = 3.31 #This number is Log10(max frequency) - Log10(min frequency) of the polar frequency grid
set xrange[-r:r]
set yrange[-r:r]
set colorbox user origin 0.9,0.1 size 0.03,0.8
splot 'new_test.dat'

# now plot the polar grid only
set style line 11 lc rgb 'black' lw 2 lt 0
set grid polar ls 11
set polar
set logscale r 10
set rrange[10:20000]
unset raxis
set rtics format '' scale 0
#set rtics axis scale
set rtics (20,50,100,200,500,1000,2000,5000,10000,20000)
do for [i=-150:180:30] {
dum = r+0.15+0.05*int(abs(i/100))+0.05*int(abs(i/140))-0.05/abs(i+1)
set label i/30+6 at first dum*cos(i), first dum*sin(i) center sprintf('%d', i)
}
set label 20 at first 0, first -(log(20)/log(10)-1) center "20"
set label 100 at first 0, first -(log(100)/log(10)-1) center "100"
set label 200 at first 0, first -(log(200)/log(10)-1) center "200"
set label 1000 at first 0, first -(log(1000)/log(10)-1) center "1k"
set label 2000 at first 0, first -(log(2000)/log(10)-1) center "2k"
set label 10000 at first 0, first -(log(10000)/log(10)-1) center "10k"
set label 20000 at first 0, first -(log(20000)/log(10)-1) center "20k"
plot NaN w l
unset multiplot
unset output
下面展示了没有对等高线控制的绘图。我需要能够指定等高线的线条颜色和宽度。如何做到?
set style increment user,然后为第1、2、3行等定义样式。这确实导致了线条的颜色和粗细发生变化,但输出似乎是随机的。线条样式被倒序递增的事实也是一个谜,而且我没有想到只能为所有等高线设置一个线宽。现在,由于您的解释,一切都清楚了。 - Charlieset linetype行为的错误报告:#1284 Change contour colors with 'set linetype'。 - Christoph