梯度可以相对于权重或输出获取 - 我们需要后者。此外,为了获得最佳结果,需要进行特定于架构的处理。下面的代码和解释涵盖了Keras/TF RNN的每种可能情况,并且应该可以轻松扩展到任何未来的API更改。
完整性: 显示的代码是简化版本 - 完整版本可在我的存储库See RNN中找到(本文包含更大的图像);包括以下内容:
- 更高的视觉自定义性
- 说明所有功能的Docstrings
- 支持Eager、Graph、TF1、TF2以及
from keras和from tf.keras
- 激活可视化
- 权重梯度可视化 (即将推出)
- 权重可视化 (即将推出)
I/O维度 (所有RNNs):
- 输入:
(batch_size, timesteps, channels) - 或者等效的(samples, timesteps, features)
- 输出: 和输入相同,除了:
channels/features现在是# of RNN units,和:return_sequences=True --> timesteps_out = timesteps_in (为每个输入时间步输出一个预测)return_sequences=False --> timesteps_out = 1 (仅在处理的最后一个时间步输出预测)
可视化方法:
- 1D绘图网格: 绘制每个通道的梯度 vs. 时间步长
- 2D热图: 绘制带有梯度强度热图的通道 vs. 时间步骤
- 0D对齐散点图: 绘制每个样本的每个通道的梯度
直方图: 没有好的方式来表示"vs.时间步"的关系- 单个样本: 对单个样本进行上述操作
- 整个批次: 对批次中所有样本执行上述操作;需要仔细处理
grads = get_rnn_gradients(model, x, y, layer_idx=1)
grads = get_rnn_gradients(model, x, y, layer_idx=2)
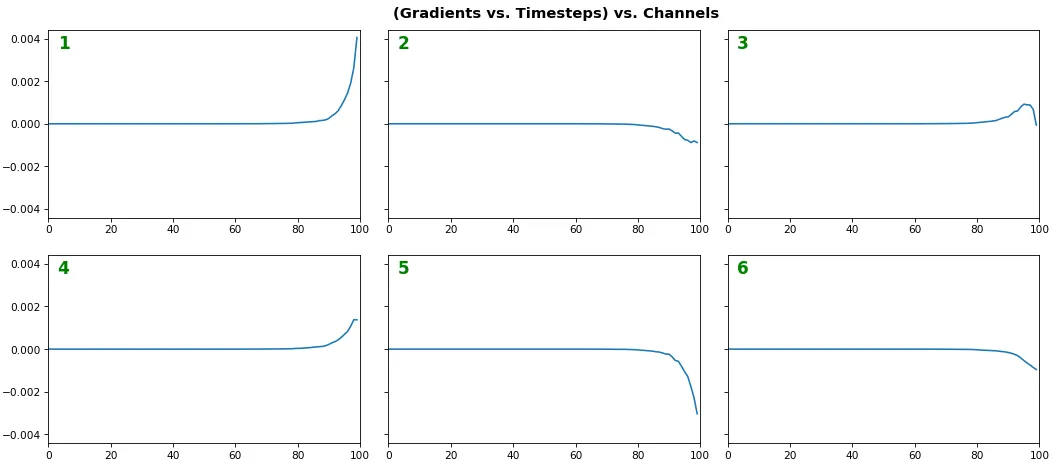
例子 1:一个样本,使用单向LSTM模型,6个神经元 -- return_sequences=True,训练了20个迭代周期。
show_features_1D(grads[0], n_rows=2)
- 注意:渐变应从右到左阅读,因为它们是计算出来的(从最后一个时间步骤到第一个时间步骤)
- 最右边(最新的)时间步骤具有更高的梯度
- 梯度消失:大约75%的最左边的时间步骤的梯度为零,表示学习时间依赖性能力差
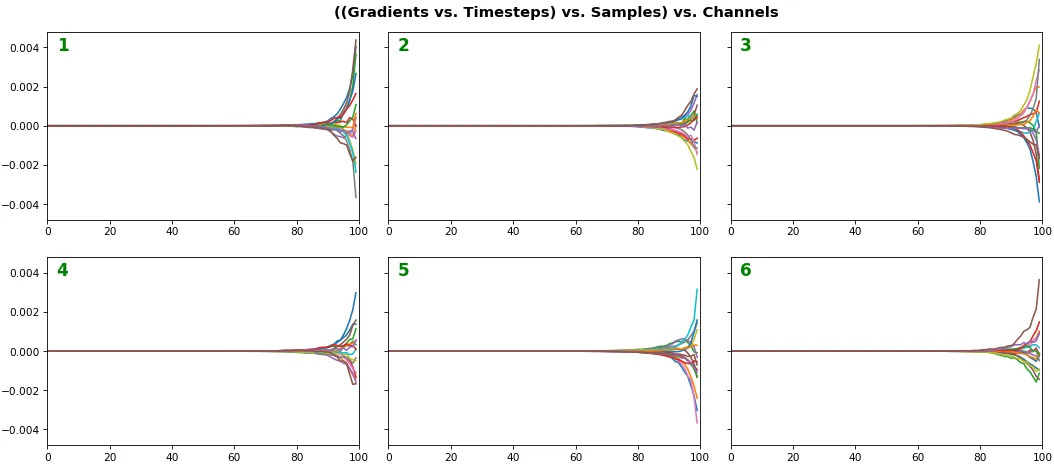
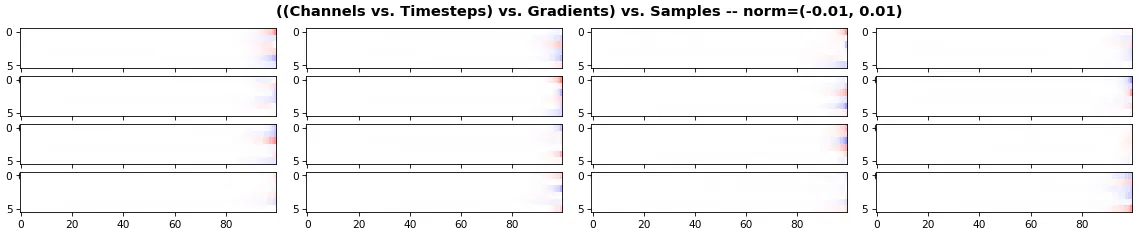
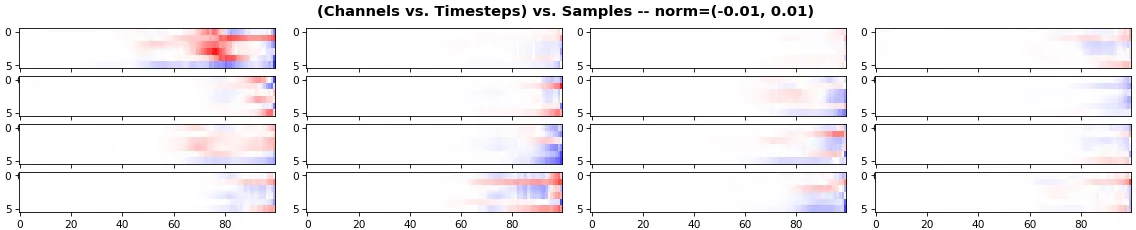
例子 2: 所有 (16) 样本,单向 LSTM,6 个单位 -- return_sequences=True,训练了 20 次迭代
show_features_1D(grads, n_rows=2)
show_features_2D(grads, n_rows=4, norm=(-.01, .01))
- 每个样本用不同的颜色表示(但相同颜色的样本跨通道一致)
- 某些样本表现比上面展示的样本略好,但差异不大
- 热图按通道(y 轴) vs. 时间步骤(x 轴)绘制;蓝色=-0.01,红色=0.01,白色=0(梯度值)
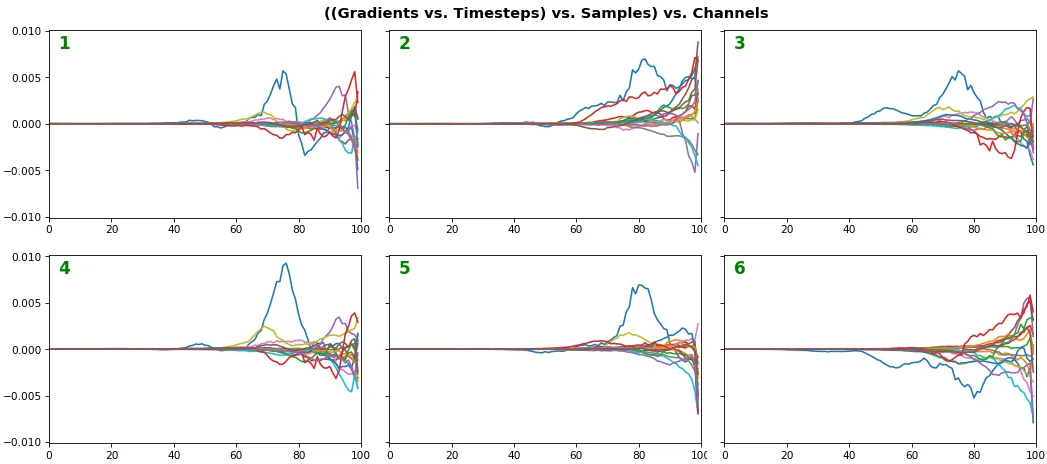
例子 3: 所有 (16) 样本,单向 LSTM,6 个单位 -- return_sequences=True,训练了 200 次迭代
show_features_1D(grads, n_rows=2)
show_features_2D(grads, n_rows=4, norm=(-.01, .01))
- 两个图表都显示 LSTM 在额外的 180 次迭代后明显表现更好
- 梯度仍在大约一半的时间步骤中消失
- 所有 LSTM 单元更好地捕获了一个特定样本(所有绘图中的蓝色曲线)的时间依赖性 - 我们可以从热图中看出该样本是第一个样本。我们可以将该样本与其他样本进行比较,以尝试理解差异
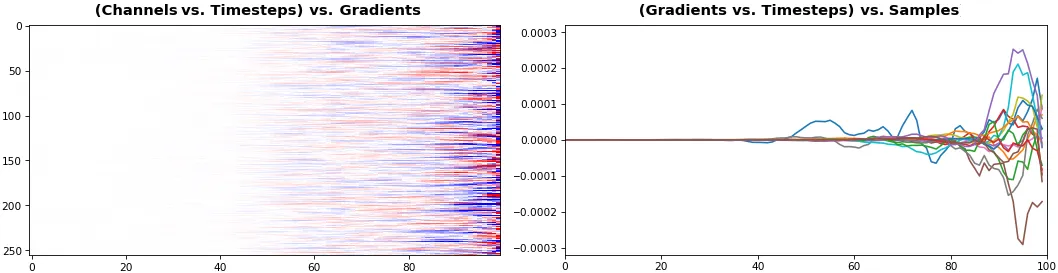
例子 4: 2D vs. 1D,单向 LSTM: 256 个单位,return_sequences=True,训练了 200 次迭代
show_features_1D(grads[0])
show_features_2D(grads[:, :, 0], norm=(-.0001, .0001))
- 2D 更适合比较少量样本的许多通道
- 1D 更适合比较众多样本的少数通道
例5:双向GRU,256个单元(总共512个) - return_sequences=True,训练400次。
show_features_2D(grads[0], norm=(-.0001, .0001), reflect_half=True)
- 为了与时间轴一致,后向层的梯度被翻转。
- 绘图揭示了Bi-RNN的一个较少知道的优势-信息效用:集体梯度覆盖了大约两倍的数据。然而,这不是免费午餐:每层都是独立的特征提取器,因此学习并不能真正得到补充。
- 预计更多单元的较低
norm,因为近似相同的损失派生梯度被分布在更多参数上(因此平方数值平均值较小)。

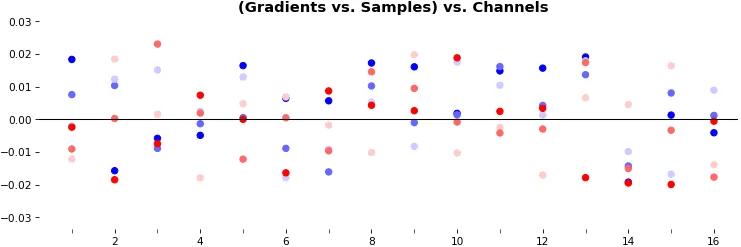
例6:0D,所有(16)样本,uni-LSTM,6个单元 -- return_sequences=False,训练200次
show_features_0D(grads)
return_sequences=False仅利用最后一个时间步的梯度(仍源自所有时间步,除非使用截断的BPTT),需要一种新方法。- 绘图为比较每个RNN单元在样本中的表现颜色编码一致(可以使用一种颜色)。
- 评估梯度流动不太直接且更具理论性。一种简单的方法是比较训练开始和后期的分布:如果差异不显著,则RNN在学习长期依赖方面表现不佳。
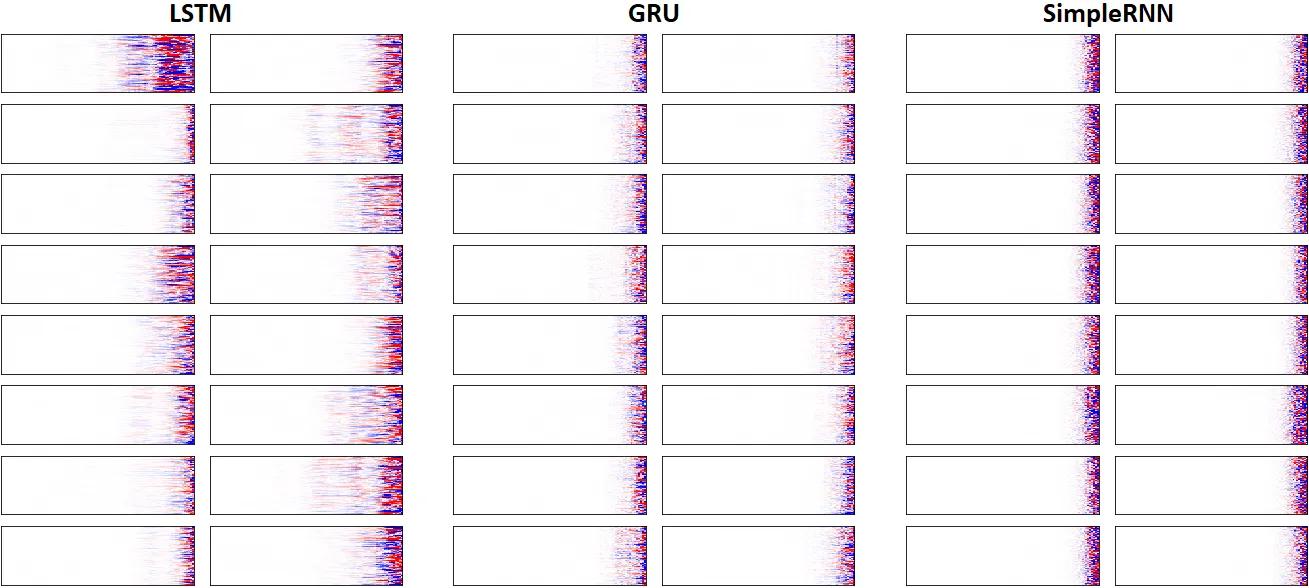
例7:LSTM vs. GRU vs. SimpleRNN,unidir,256个单元 -- return_sequences=True,训练250次
show_features_2D(grads, n_rows=8, norm=(-.0001, .0001), show_xy_ticks=[0,0], show_title=False)
- 注意:比较并不是非常有意义;每个网络都有不同的超参数,而所有网络都使用相同的超参数。例如,LSTM每个单元的参数最多,淹没了SimpleRNN。
- 在这种设置下,LSTM明确地打败了GRU和SimpleRNN。
可视化函数:
def get_rnn_gradients(model, input_data, labels, layer_idx=None, layer_name=None,
                      sample_weights=None):
    if layer is None:
        layer = _get_layer(model, layer_idx, layer_name)

    grads_fn = _make_grads_fn(model, layer, mode)
    sample_weights = sample_weights or np.ones(len(input_data))
    grads = grads_fn([input_data, sample_weights, labels, 1])

    while type(grads) == list:
        grads = grads[0]
    return grads

def _make_grads_fn(model, layer):
    grads = model.optimizer.get_gradients(model.total_loss, layer.output)
    return K.function(inputs=[model.inputs[0],  model.sample_weights[0],
                              model._feed_targets[0], K.learning_phase()], outputs=grads)

def _get_layer(model, layer_idx=None, layer_name=None):
    if layer_idx is not None:
        return model.layers[layer_idx]

    layer = [layer for layer in model.layers if layer_name in layer.name]
    if len(layer) > 1:
        print("WARNING: multiple matching layer names found; "
              + "picking earliest")
    return layer[0]


def show_features_1D(data, n_rows=None, label_channels=True,
                     equate_axes=True, max_timesteps=None, color=None,
                     show_title=True, show_borders=True, show_xy_ticks=[1,1],
                     title_fontsize=14, channel_axis=-1,
                     scale_width=1, scale_height=1, dpi=76):
    def _get_title(data, show_title):
        if len(data.shape)==3:
            return "((Gradients vs. Timesteps) vs. Samples) vs. Channels"
        else:
            return "((Gradients vs. Timesteps) vs. Channels"

    def _get_feature_outputs(data, subplot_idx):
        if len(data.shape)==3:
            feature_outputs = []
            for entry in data:
                feature_outputs.append(entry[:, subplot_idx-1][:max_timesteps])
            return feature_outputs
        else:
            return [data[:, subplot_idx-1][:max_timesteps]]

    if len(data.shape)!=2 and len(data.shape)!=3:
        raise Exception("`data` must be 2D or 3D")

    if len(data.shape)==3:
        n_features = data[0].shape[channel_axis]
    else:
        n_features = data.shape[channel_axis]
    n_cols = int(n_features / n_rows)

    if color is None:
        n_colors = len(data) if len(data.shape)==3 else 1
        color = [None] * n_colors

    fig, axes = plt.subplots(n_rows, n_cols, sharey=equate_axes, dpi=dpi)
    axes = np.asarray(axes)

    if show_title:
        title = _get_title(data, show_title)
        plt.suptitle(title, weight='bold', fontsize=title_fontsize)
    fig.set_size_inches(12*scale_width, 8*scale_height)

    for ax_idx, ax in enumerate(axes.flat):
        feature_outputs = _get_feature_outputs(data, ax_idx)
        for idx, feature_output in enumerate(feature_outputs):
            ax.plot(feature_output, color=color[idx])

        ax.axis(xmin=0, xmax=len(feature_outputs[0]))
        if not show_xy_ticks[0]:
            ax.set_xticks([])
        if not show_xy_ticks[1]:
            ax.set_yticks([])
        if label_channels:
            ax.annotate(str(ax_idx), weight='bold',
                        color='g', xycoords='axes fraction',
                        fontsize=16, xy=(.03, .9))
        if not show_borders:
            ax.set_frame_on(False)

    if equate_axes:
        y_new = []
        for row_axis in axes:
            y_new += [np.max(np.abs([col_axis.get_ylim() for
                                     col_axis in row_axis]))]
        y_new = np.max(y_new)
        for row_axis in axes:
            [col_axis.set_ylim(-y_new, y_new) for col_axis in row_axis]
    plt.show()


def show_features_2D(data, n_rows=None, norm=None, cmap='bwr', reflect_half=False,
                     timesteps_xaxis=True, max_timesteps=None, show_title=True,
                     show_colorbar=False, show_borders=True,
                     title_fontsize=14, show_xy_ticks=[1,1],
                     scale_width=1, scale_height=1, dpi=76):
    def _get_title(data, show_title, timesteps_xaxis, vmin, vmax):
        if timesteps_xaxis:
            context_order = "(Channels vs. %s)" % "Timesteps"
        if len(data.shape)==3:
            extra_dim = ") vs. Samples"
            context_order = "(" + context_order
        return "{} vs. {}{} -- norm=({}, {})".format(context_order, "Timesteps",
                                                     extra_dim, vmin, vmax)

    vmin, vmax = norm or (None, None)
    n_samples = len(data) if len(data.shape)==3 else 1
    n_cols = int(n_samples / n_rows)

    fig, axes = plt.subplots(n_rows, n_cols, dpi=dpi)
    axes = np.asarray(axes)

    if show_title:
        title = _get_title(data, show_title, timesteps_xaxis, vmin, vmax)
        plt.suptitle(title, weight='bold', fontsize=title_fontsize)

    for ax_idx, ax in enumerate(axes.flat):
        img = ax.imshow(data[ax_idx], cmap=cmap, vmin=vmin, vmax=vmax)
        if not show_xy_ticks[0]:
            ax.set_xticks([])
        if not show_xy_ticks[1]:
            ax.set_yticks([])
        ax.axis('tight')
        if not show_borders:
            ax.set_frame_on(False)

    if show_colorbar:
        fig.colorbar(img, ax=axes.ravel().tolist())

    plt.gcf().set_size_inches(8*scale_width, 8*scale_height)
    plt.show()


def show_features_0D(data, marker='o', cmap='bwr', color=None,
                     show_y_zero=True, show_borders=False, show_title=True,
                     title_fontsize=14, markersize=15, markerwidth=2,
                     channel_axis=-1, scale_width=1, scale_height=1):
    if color is None:
        cmap = cm.get_cmap(cmap)
        cmap_grad = np.linspace(0, 256, len(data[0])).astype('int32')
        color = cmap(cmap_grad)
        color = np.vstack([color] * data.shape[0])
    x = np.ones(data.shape) * np.expand_dims(np.arange(1, len(data) + 1), -1)

    if show_y_zero:
        plt.axhline(0, color='k', linewidth=1)
    plt.scatter(x.flatten(), data.flatten(), marker=marker,
                s=markersize, linewidth=markerwidth, color=color)
    plt.gca().set_xticks(np.arange(1, len(data) + 1), minor=True)
    plt.gca().tick_params(which='minor', length=4)

    if show_title:
        plt.title("(Gradients vs. Samples) vs. Channels",
                  weight='bold', fontsize=title_fontsize)
    if not show_borders:
        plt.box(None)
    plt.gcf().set_size_inches(12*scale_width, 4*scale_height)
    plt.show()
完整的最简示例:请参阅存储库的README
额外的代码:
- 我怎样才能在不阅读源代码的情况下检查权重/门的顺序?
rnn_cell = model.layers[1].cell
rnn_cell = model.layers[1].forward_layer
print(rnn_cell.__dict__)
为了更方便的代码,请查看存储库的rnn_summary
奖励知识点:如果在GRU上运行上述代码,您可能会注意到bias没有门;为什么呢?从文档中得知:
有两个变体。 默认值基于1406.1078v3,并在矩阵乘法之前将重置门应用于隐藏状态。另一个基于原始的1406.1078v1,顺序相反。
第二个变体与CuDNNGRU(仅GPU)兼容,并允许在CPU上进行推断。因此,它具有用于内核和recurrent_kernel的单独偏差。使用'reset_after'=True和recurrent_activation ='sigmoid'。