我已经在网上进行了足够的搜索,但没有找到答案。
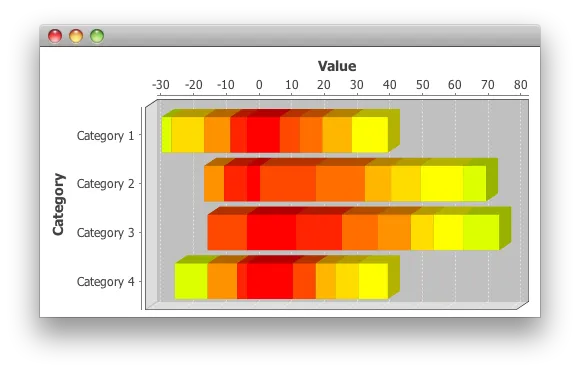
我创建了一个堆叠的3D条形图,但无法更改默认颜色。我尝试了所有提供的建议。
以下是我的代码片段。这是我的输入。
来自数据库的数据是:
A 0 2 B 15 53 C 0 2 D 0 2 E 0 1 F 1 0 G 0 1
不知何故,我将其转换为数据集需求,并添加了项目和模型。
我创建了一个堆叠的3D条形图,但无法更改默认颜色。我尝试了所有提供的建议。
以下是我的代码片段。这是我的输入。
来自数据库的数据是:
A 0 2 B 15 53 C 0 2 D 0 2 E 0 1 F 1 0 G 0 1
不知何故,我将其转换为数据集需求,并添加了项目和模型。
CategoryDataset dataset = DatasetUtilities.createCategoryDataset(item,models, data);
chart = ChartFactory.createStackedBarChart3D(chartDescription, X-axis, Y-axis, dataset,PlotOrientation.VERTICAL, true, true, true);
CategoryPlot plot = chart.getCategoryPlot();
CategoryItemRenderer r = plot.getRenderer();
r.setSeriesPaint(0, Color.GREEN);
r.setSeriesPaint(1, Color.GRAY);
 plot.setRenderer(new StackedBarRenderer3D() {

@Override
public Paint getItemPaint(int row, int col) {
    System.out.println("row:"+row);
    System.out.println("Col:"+col);
    return Color.getHSBColor(row / 42f, 1, 1);
}
});
CategoryAxis domainAxis = plot.getDomainAxis();
domainAxis.setCategoryLabelPositions(CategoryLabelPositions.UP_90);

NumberAxis rangeAxis = (NumberAxis) plot.getRangeAxis();
rangeAxis.setStandardTickUnits(NumberAxis.createIntegerTickUnits());

StackedBarRenderer3D renderer = (StackedBarRenderer3D)plot.getRenderer();
//renderer.setBarPainter(new StandardBarPainter());
renderer.setSeriesFillPaint(0,Color.BLACK);
renderer.setSeriesFillPaint(1,Color.GREEN);
renderer.setDrawBarOutline(false);
renderer.setShadowVisible(false);
renderer.setBasePositiveItemLabelPosition(new ItemLabelPosition(ItemLabelAnchor.CENTER,TextAnchor.CENTER));
renderer.setBaseItemLabelGenerator(new StandardCategoryItemLabelGenerator());
renderer.setIgnoreZeroValues(true);
renderer.setMaximumBarWidth(.05);
renderer.setBaseItemLabelsVisible(true);
renderer.setBaseToolTipGenerator(new StandardCategoryToolTipGenerator());
renderer.setPositiveItemLabelPositionFallback(new ItemLabelPosition(
    ItemLabelAnchor.CENTER, TextAnchor.CENTER_RIGHT));
renderer.setNegativeItemLabelPositionFallback(new ItemLabelPosition(
ItemLabelAnchor.CENTER, TextAnchor.CENTER_RIGHT));
renderer.setBasePositiveItemLabelPosition(new ItemLabelPosition(
    ItemLabelAnchor.CENTER, TextAnchor.TOP_CENTER));
renderer.setBaseNegativeItemLabelPosition(new ItemLabelPosition(
    ItemLabelAnchor.CENTER, TextAnchor.TOP_CENTER));
LegendTitle legend = chart.getLegend(0);
legend.setBackgroundPaint(Color.white);
legend.setFrame(new BlockBorder(Color.green));
StandardChartTheme theme = (StandardChartTheme)org.jfree.chart.StandardChartTheme.createJFreeTheme();
theme.setTitlePaint(Color.decode("#4572a7"));
theme.setExtraLargeFont(new Font("Arial",Font.BOLD, 16) );
theme.setLargeFont(new Font("Arial",Font.BOLD, 15));
theme.setRegularFont( new Font("Arial",Font.PLAIN, 11));
theme.setRangeGridlinePaint(Color.RED);
theme.setPlotBackgroundPaint( Color.white );
theme.setChartBackgroundPaint( Color.white );
theme.setItemLabelPaint(Color.YELLOW);
theme.setShadowVisible(true);
theme.setAxisLabelPaint( Color.decode("#666666")    );
theme.apply( chart );
我曾尝试使用setSeriespaint,但它并没有起作用。这与图表、绘图和渲染器的创建顺序有关吗?
当我打印行和列时,得到了以下结果:
行:1
列:0
行:0
列:1
行:1
列:1
行:1
列:2
行:1
列:3
行:1
列:4
行:0
列:5
行:1
列:6
row和col来决定使用什么颜色。 - Catalina Islandcol选择调色板;这里有一个相关的示例;还可以参考这里引用的DrawingSupplier方法。 - trashgod