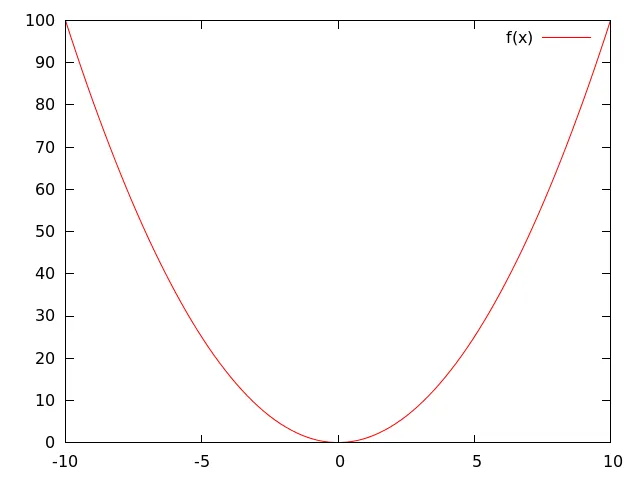
在Gnuplot中绘制Python函数并不直观,尽管有一些解决方案。例如,可以将其值转换为数组,或者手动将其表达式翻译成Gnuplot的语法。下面是一个使用模块
Gnuplot.py作为接口的示例:#!/usr/bin/env python
import Gnuplot
import numpy as np
## define function ##
func = lambda x, x0, y0, w: y0 * np.exp( -4*np.log(2) * ( (x-x0) / w )**2 )
# also works with a regular function:
# def func(x, x0, y0, w):
# return y0 * np.exp( -4*np.log(2) * ( (x-x0) / w )**2 )
popt = (10.1, 5, 2)
## linspace ##
x = np.linspace(0, 20, num=1000) # (x min, x max, number of points)
y = func(x, *popt)
func_linspace = Gnuplot.Data(x, y, with_='lines', title='linspace')
## expression “translation” (lambda only) ##
func_translation = Gnuplot.Func(
'{y0} * exp( -4*log(2) * ( (x-{x0}) / {w} )**2 )'.format(
x0=popt[0],
y0=popt[1],
w=popt[2],
),
title='expression translation')
## plot ##
g = Gnuplot.Gnuplot()
g.plot(func_linspace, func_translation)
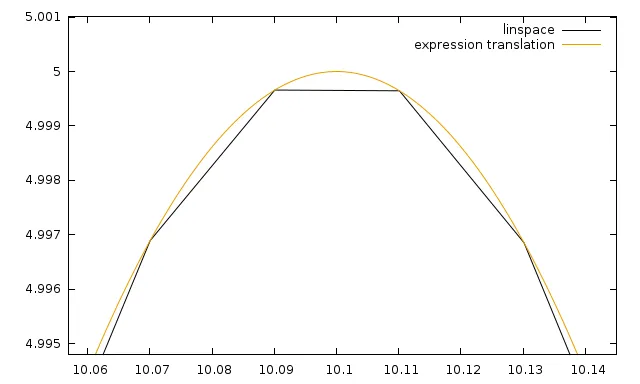
第一种方法在处理相当数量的点时效果良好,但是当缩放过多或将窗口更改为超出数组限制时会失败,而第二种方法在任何缩放级别下都有效。为了说明这一点,让我们放大上一个脚本的输出:
因此,找到一种将Python函数(lambda或常规函数)绘制为Gnuplot函数的方法是很有趣的。我可以想到两种解决方案:自动翻译表达式(仅适用于“简单”的lambda函数),或者让Gnuplot直接使用Python函数。
第一种解决方案:表达式翻译(仅适用于简单的lambda函数)
这种方法不仅难以自动化,而且对于复杂的函数来说也无法实现。但是,我们仍然可以使用这种方法来处理简单的lambda函数。为了勾画实现的行为:
>>> def lambda_to_gnuplot(func, popt):
...     # determine if translation is possible
...     # extract function expression and replace parameters with values
...     return func_expression # str
>>> lambda_to_gnuplot(
...     lambda x, x0, y0, w: y0 * np.exp( -4*np.log(2) * ( (x-x0) / w )**2),
...     (10.1, 5, 2))
'5 * exp( -4*log(2) * ( (x-10.1) / 2 )**2 )'
有没有办法在Python中实现这个lambda_to_gnuplot函数?
第二种解决方案:直接将Python函数传递给Gnuplot
“完美”的解决方案是让Gnuplot使用Python函数。在我最大胆的梦想中,它应该是这样的:
>>> def func(x, x0, y0, w):
...     if x < x0:
...         return 0
...     else:
...         return y0 * np.exp( -4*np.log(2) * ( (x-x0) / w )**2)
>>> func_direct = Gnuplot.PyFunction(lambda x: func(x, 10.1, 5, 2))
>>> g.plot(func_direct)
这是最容易使用的解决方案,但如果不是不可能的话,它的实现将非常困难。您有关于如何实现此解决方案的任何提示吗?当然,答案可能会绕过Gnuplot.py。