如何在谷歌地图多边形内绘制直线

5

我使用谷歌地图JavaScript API V3创建了一个谷歌地图。我正在绘制许多邮政编码的多边形。这些多边形根据某些条件具有不同的颜色。现在,我想在某些多边形内部绘制直线/哈希标记,具体取决于某些条件。我们应该如何实现呢?以下是我用于绘制多边形的代码:

{% if zip.zip_info.zip_polygon %}
    var path = [
        {% for polycoord in zip.zip_info.zip_polygon %}
            new google.maps.LatLng({{polycoord.1}}, {{polycoord.0}}),
        {% endfor %}
        ];

    var polygon_{{ forloop.counter }} = new google.maps.Polygon(
    {
        path:path, 
        clickable:true,
        strokeColor: '#000000',
        strokeOpacity: 0.15,
        strokeWeight: 2,
        fillColor: fillColor,
        fillOpacity: 1,
        zipcode: '{{zip.zip_info.zipcode}}'
    });

    polygon_{{ forloop.counter }}.setMap(map);

{% endif %}

我也提供了我需求的图片链接。 enter image description here 
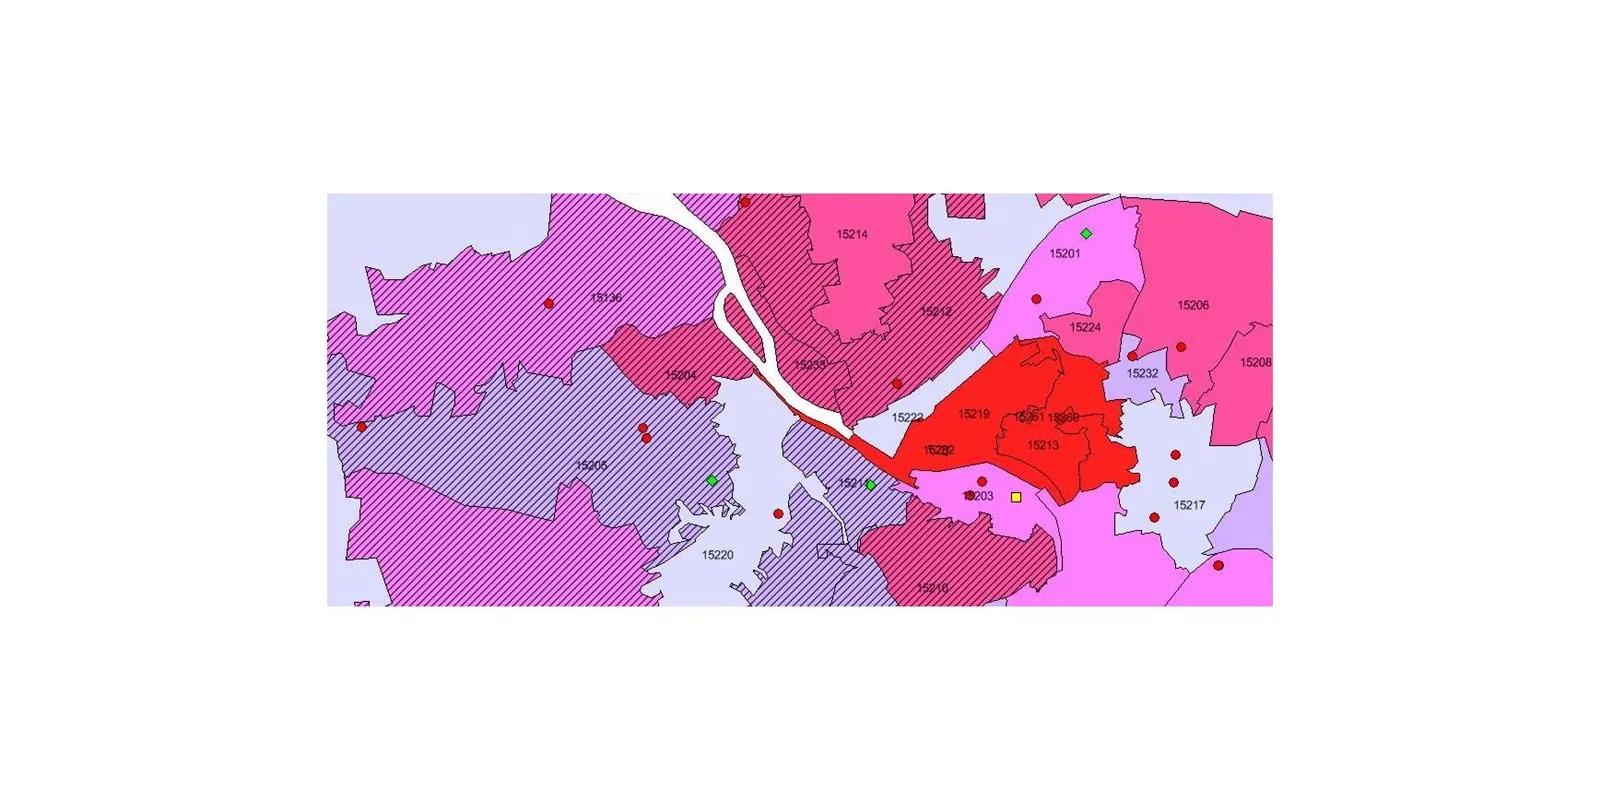
您可以看到图片中一些多边形用直线阴影填充,而另一些则只用颜色填充。

听起来你想要一个填充“纹理”,就像这个增强请求 - geocodezip
是的,想要添加纹理,换句话说,我想在多边形内画线。我们能做到吗? - sandeep
目前无法使用API完成此操作。您可以投票支持该增强请求(或寻找其他更好的请求以满足您的需求,或创建一个新的请求)。您可能可以通过使用折线来实现某些功能,但这可能会影响性能。 - geocodezip
谢谢geocodezip。但是我在哪里可以发布API增强请求或投票呢?请指教。 - sandeep
我第一条评论中的链接。(https://code.google.com/p/gmaps-api-issues/issues/detail?id=598) - geocodezip
3个回答

8
我一直在研究同样的问题。 我目前所拥有的是: 示例的jsFiddle BW.PolyLineFill函数创建了一个自定义覆盖物。 它需要四个参数,最后两个是可选的。
 1. path: an array of Google LatLng objects   
 2. map: the map to attach theoverlay to 
 3. fillColor: (optional) the color of the fill, default is red. 
 4. strokeColor: (optional) the stroke color, default is black

我还没有测试过性能,可能还需要更多的调整,但它应该能让您开始。

相关代码:

PolyLineFill.prototype = new google.maps.OverlayView();
function PolyLineFill(poly, map, fill, stroke) {
    var bounds = new google.maps.LatLngBounds();
    for (var i = 0; i < poly.length; i++) {
        bounds.extend(poly[i]);
    }

    //initialize all properties.
    this.bounds_ = bounds;
    this.map_ = map;
    this.div_ = null;
    this.poly_ = poly;
    this.polysvg_ = null;
    this.fill_ = fill;
    this.stroke_ = stroke;

    // Explicitly call setMap on this overlay
    this.setMap(map);
}

PolyLineFill.prototype.onAdd = function () {
    // Create the DIV and set some basic attributes.
    var div = document.createElement('div');
    div.style.borderStyle = 'none';
    div.style.borderWidth = '0px';
    div.style.position = 'absolute';

    //createthe svg element
    var svgns = "http://www.w3.org/2000/svg";
    var svg = document.createElementNS(svgns, "svg");
    svg.setAttributeNS(null, "preserveAspectRatio", "xMidYMid meet");

    var def = document.createElementNS(svgns, "defs");

    //create the pattern fill 
    var pattern = document.createElementNS(svgns, "pattern");
    pattern.setAttributeNS(null, "id", "lineFill");
    pattern.setAttributeNS(null, "patternUnits", "userSpaceOnUse");
    pattern.setAttributeNS(null, "patternTransform", "rotate(-45)");
    pattern.setAttributeNS(null, "height", "7");
    pattern.setAttributeNS(null, "width", "7");
    def.appendChild(pattern);

    var rect = document.createElementNS(svgns, "rect");
    rect.setAttributeNS(null, "id", "rectFill");
    rect.setAttributeNS(null, "fill", this.fill_ || "red");
    rect.setAttributeNS(null, "fill-opacity", "0.3");
    rect.setAttributeNS(null, "stroke", this.stroke_ || "#000");
    rect.setAttributeNS(null, "stroke-dasharray", "7,7");
    rect.setAttributeNS(null, "height", "7");
    rect.setAttributeNS(null, "width", "7");
    pattern.appendChild(rect);

    svg.appendChild(def);

    //add polygon to the div
    var p = document.createElementNS(svgns, "polygon");
    p.setAttributeNS(null, "fill", "url(#lineFill)");
    p.setAttributeNS(null, "stroke", "#000");
    p.setAttributeNS(null, "stroke-width", "1");
    //set a reference to this element;
    this.polysvg_ = p;
    svg.appendChild(p);

    div.appendChild(svg);

    // Set the overlay's div_ property to this DIV
    this.div_ = div;

    // We add an overlay to a map via one of the map's panes.
    // We'll add this overlay to the overlayLayer pane.
    var panes = this.getPanes();
    panes.overlayLayer.appendChild(div);
}

PolyLineFill.prototype.AdjustPoints = function () {
    //adjust the polygon points based on the projection.
    var proj = this.getProjection();
    var sw = proj.fromLatLngToDivPixel(this.bounds_.getSouthWest());
    var ne = proj.fromLatLngToDivPixel(this.bounds_.getNorthEast());

    var points = "";
    for (var i = 0; i < this.poly_.length; i++) {
        var point = proj.fromLatLngToDivPixel(this.poly_[i]);
        if (i == 0) {
            points += (point.x - sw.x) + ", " + (point.y - ne.y);
        } else {
            points += " " + (point.x - sw.x) + ", " + (point.y - ne.y);
        }
    }
    return points;
}

PolyLineFill.prototype.draw = function () {
    // Size and position the overlay. We use a southwest and northeast
    // position of the overlay to peg it to the correct position and size.
    // We need to retrieve the projection from this overlay to do this.
    var overlayProjection = this.getProjection();

    // Retrieve the southwest and northeast coordinates of this overlay
    // in latlngs and convert them to pixels coordinates.
    // We'll use these coordinates to resize the DIV.
    var sw = overlayProjection
                .fromLatLngToDivPixel(this.bounds_.getSouthWest());
    var ne = overlayProjection
                .fromLatLngToDivPixel(this.bounds_.getNorthEast());

    // Resize the image's DIV to fit the indicated dimensions.
    var div = this.div_;
    div.style.left = sw.x + 'px';
    div.style.top = ne.y + 'px';
    div.style.width = (ne.x - sw.x) + 'px';
    div.style.height = (sw.y - ne.y) + 'px';

    this.polysvg_.setAttributeNS(null, "points", this.AdjustPoints());
}

PolyLineFill.prototype.onRemove = function () {
    this.div_.parentNode.removeChild(this.div_);
    this.div_ = null;
}
window.BW = {};
window.BW.PolyLineFill = PolyLineFill;

这方面有进展吗?看起来它能工作,但是一旦你缩放,事情就不正确了。 - BigDubb
@BigDubb,你能具体说明哪里出了问题吗?上面的fiddle示例中的覆盖层示例与Google地图定义的边界不完全对齐,因为我快速获取了一些Geodata来用于示例。地图投影可能在收集数据时使用的投影和Google的投影之间略有不同。更准确的数据将会得到更好的结果,或者至少是与Google所选择的投影一致的数据。我相信Google使用的是Mercator投影,因此如果您使用其他类型,将在转换为屏幕坐标时产生轻微的偏移。 - Bryan Weaver
我在Chrome中启动它。将视图缩放到犹他州,一旦超过特定的缩放级别,它就无法正确绘制多边形。其中的某些部分无法渲染,如果你缩放得足够大,它就会完全消失。 - BigDubb
我已经在我的应用中实现了你的解决方案,但我遇到了跟@BigDubb看到的相同问题。除非你已经有修补程序来解决它,否则我会检查代码以确定是否可以修复它。 - christiansr85
4
我已经修复了地图缩放时出现的奇怪行为(svg 被裁剪掉了)。我添加了一个 CSS 类来使其高度和宽度都为 100%。现在缩放问题已经解决。另一方面,我改变了渲染形状的类型。我用 path 替换了 polygon,因为在我的测试中,path 元素对于鼠标事件如鼠标悬停、鼠标单击等有更好的响应。这是我的示例链接 - christiansr85
如果现在有人能指点一下如何使它与多边形(带孔洞的多边形)一起工作就好了 :) - Tarmo

1

我曾经为Bryan Weaver的解决方案工作,使其支持使用绘图管理器进行可编辑多边形。这里是我的jsfiddle示例链接

function initialize() {
   var map = new google.maps.Map(document.getElementById('map-canvas'), {
     zoom: 5,
     center: {
       lat: 24.886,
       lng: -70.268
     },
     mapTypeId: 'terrain'
   });

   var drawingManager = new google.maps.drawing.DrawingManager({
     drawingControl: true,
     drawingControlOptions: {
       position: google.maps.ControlPosition.TOP_CENTER,
       drawingModes: [google.maps.drawing.OverlayType.POLYGON]
     },

     polygonOptions: {
       fillOpacity: 0,
       strokeWeight: 1,
       strokeColor: '#ff0000',
       clickable: true,
       editable: true,
       draggable: true,
     }
   });

   drawingManager.setMap(map);
   google.maps.event.addListener(drawingManager, 'overlaycomplete', function(event) {
     var poly = event.overlay;
     poly.bk = new BW.PolyLineFill(poly.getPath(), this.map, "red", "#000");

     google.maps.event.addListener(poly, 'dragstart', function(event) {
       if (poly.bk != null) {
         poly.bk.setMap(null);
         poly.bk = null
       }
       poly.isBeingDragged = true;
     });

     google.maps.event.addListener(poly, 'dragend', function(event) {
       if (poly.bk != null) {
         poly.bk.setMap(null);
         poly.bk = null
       }
       poly.bk = new BW.PolyLineFill(poly.getPath(), poly.map, "red", "#000");
       poly.isBeingDragged = false;
     });


     google.maps.event.addListener(poly.getPath(), 'set_at', function(event) {
       if (poly.isBeingDragged) return;
       console.log('set_at');
       if (poly.bk != null) {
         poly.bk.setMap(null);
         poly.bk = null
       }
       poly.bk = new BW.PolyLineFill(poly.getPath(), poly.map, "red", "#000");
     });

     google.maps.event.addListener(poly.getPath(), 'insert_at', function(event) {
       if (poly.bk != null) {
         poly.bk.setMap(null);
         poly.bk = null
       }
       poly.bk = new BW.PolyLineFill(poly.getPath().b, poly.map, "red", "#000");
     });


     drawingManager.setDrawingMode(null);
   });

 }

 ///Start custom poly fill code
 PolyLineFill.prototype = new google.maps.OverlayView();

 function PolyLineFill(poly, map, fill, stroke) {
   var bounds = new google.maps.LatLngBounds();
   for (var i = 0; i < poly.length; i++) {
     bounds.extend(poly.getAt(i));
   }

   //initialize all properties.
   this.bounds_ = bounds;
   this.map_ = map;
   this.div_ = null;
   this.poly_ = poly;
   this.polysvg_ = null;
   this.fill_ = fill;
   this.stroke_ = stroke;

   // Explicitly call setMap on this overlay
   this.setMap(map);
 }

 PolyLineFill.prototype.onAdd = function() {
   // Create the DIV and set some basic attributes.
   var div = document.createElement('div');
   div.style.borderStyle = 'none';
   div.style.borderWidth = '0px';
   div.style.position = 'absolute';

   //https://www.w3schools.com/graphics/svg_reference.asp
   //createthe svg element
   var svgns = "http://www.w3.org/2000/svg";
   var svg = document.createElementNS(svgns, "svg");
   svg.setAttributeNS(null, "height", "100%");
   svg.setAttributeNS(null, "width", "100%");
   svg.setAttributeNS(null, "preserveAspectRatio", "xMidYMid meet");

   //A container for referenced elements
   var def = document.createElementNS(svgns, "defs");

   //create the pattern fill 
   var pattern = document.createElementNS(svgns, "pattern");
   //***************************CHANGE PATTERN HERE**********************************     
   pattern.setAttributeNS(null, "id", "lineFill");
   pattern.setAttributeNS(null, "patternUnits", "userSpaceOnUse");
   //pattern.setAttributeNS(null, "patternTransform", "rotate(-33)");

   pattern.setAttributeNS(null, "height", "60");
   pattern.setAttributeNS(null, "width", "60");
   def.appendChild(pattern);

   var rect = document.createElementNS(svgns, "rect");
   rect.setAttributeNS(null, "id", "rectFill");
   rect.setAttributeNS(null, "fill", "green");
   rect.setAttributeNS(null, "fill-opacity", "0.25");
   rect.setAttributeNS(null, "stroke", "#0000FF");
   rect.setAttributeNS(null, "stroke-width", "8");
   rect.setAttributeNS(null, "stroke-opacity", "0.25");
   rect.setAttributeNS(null, "stroke-dasharray", "10 10");
   rect.setAttributeNS(null, "x", "5");
   rect.setAttributeNS(null, "y", "5");
   rect.setAttributeNS(null, "height", "50");
   rect.setAttributeNS(null, "width", "50");
   rect.setAttributeNS(null, "rx", "25");
   rect.setAttributeNS(null, "ry", "25");
   pattern.appendChild(rect);

   svg.appendChild(def);

   //add polygon to the div
   var p = document.createElementNS(svgns, "polygon");
   p.setAttributeNS(null, "fill", "url(#lineFill)");
   //set a reference to this element;
   this.polysvg_ = p;
   svg.appendChild(p);

   div.appendChild(svg);

   // Set the overlay's div_ property to this DIV
   this.div_ = div;

   // We add an overlay to a map via one of the map's panes.
   // We'll add this overlay to the overlayLayer pane.
   var panes = this.getPanes();
   panes.overlayLayer.appendChild(div);
 }

 PolyLineFill.prototype.AdjustPoints = function() {
   //adjust the polygon points based on the projection.
   var proj = this.getProjection();
   var sw = proj.fromLatLngToDivPixel(this.bounds_.getSouthWest());
   var ne = proj.fromLatLngToDivPixel(this.bounds_.getNorthEast());

   var points = "";
   for (var i = 0; i < this.poly_.length; i++) {
     var point = proj.fromLatLngToDivPixel(this.poly_.getAt(i));
     if (i == 0) {
       points += (point.x - sw.x) + ", " + (point.y - ne.y);
     } else {
       points += " " + (point.x - sw.x) + ", " + (point.y - ne.y);
     }
   }
   return points;
 }

 PolyLineFill.prototype.draw = function() {
   // Size and position the overlay. We use a southwest and northeast
   // position of the overlay to peg it to the correct position and size.
   // We need to retrieve the projection from this overlay to do this.
   var overlayProjection = this.getProjection();

   // Retrieve the southwest and northeast coordinates of this overlay
   // in latlngs and convert them to pixels coordinates.
   // We'll use these coordinates to resize the DIV.
   var sw = overlayProjection.fromLatLngToDivPixel(this.bounds_.getSouthWest());
   var ne = overlayProjection.fromLatLngToDivPixel(this.bounds_.getNorthEast());

   // Resize the image's DIV to fit the indicated dimensions.
   var div = this.div_;
   div.style.left = sw.x + 'px';
   div.style.top = ne.y + 'px';
   div.style.width = (ne.x - sw.x) + 'px';
   div.style.height = (sw.y - ne.y) + 'px';

   this.polysvg_.setAttributeNS(null, "points", this.AdjustPoints());
 }

 PolyLineFill.prototype.onRemove = function() {
   this.div_.parentNode.removeChild(this.div_);
   this.div_ = null;
 }
 window.BW = {};
 window.BW.PolyLineFill = PolyLineFill;
 ///end poly fill code


 google.maps.event.addDomListener(window, 'load', initialize);


 //**************************velho
 function showArrays(event) {
   if (this.overlay)
     this.overlay.setMap(null)
   this.overlay = new BW.PolyLineFill(this.getPath().b, this.map, "red", "#000");
 }
     html,
     body {
       height: 100%;
       margin: 0;
       padding: 0;
     }
     
     #map-canvas,
     #map_canvas {
       height: 100%;
     }
     
     @media print {
       html,
       body {
         height: auto;
       }
       #map_canvas {
         height: 650px;
       }
     }
<script src="https://maps.google.com/maps/api/js?sensor=false&libraries=drawing&.js"></script>
<div id="map-canvas"></div>


-1

这可以在CANVAS中完成:

http://home.provide.net/~bratliff/hawaii/

点击“样式”单选按钮以查看其他可选模式。


是的,我看到了链接中的示例,它可以工作。但是我们能否使用Google Map V3 API js来实现呢? - sandeep
这仅适用于静态图像,可能是他们正在使用谷歌静态地图的原因。 - Dennis

网页内容由stack overflow 提供, 点击上面的
可以查看英文原文,
原文链接