您用来生成调色板的代码运行良好。您只需要提供与 heatmap 匹配的数据即可。以下代码提供了此功能:
library(RColorBrewer)
library(plotly)
palette <- colorRampPalette(c("darkblue", "blue", "lightblue1",
"green","yellow", "red", "darkred"))
set.seed(9876)
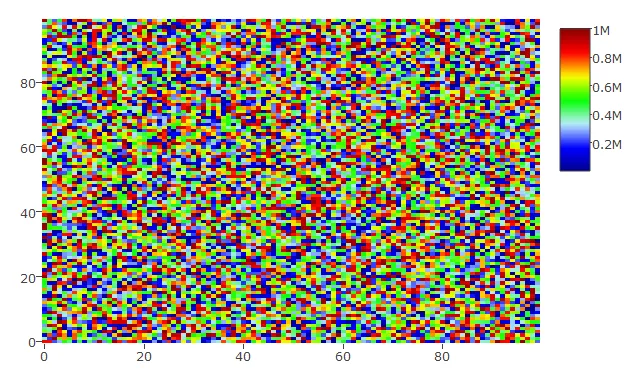
hmdata <- matrix(data = sample(x = 1:10^6, size = 100*100), nrow = 100, ncol = 100)
plot_ly(z = hmdata, colors = palette(50), type = "heatmap")
这将生成以下热力图:
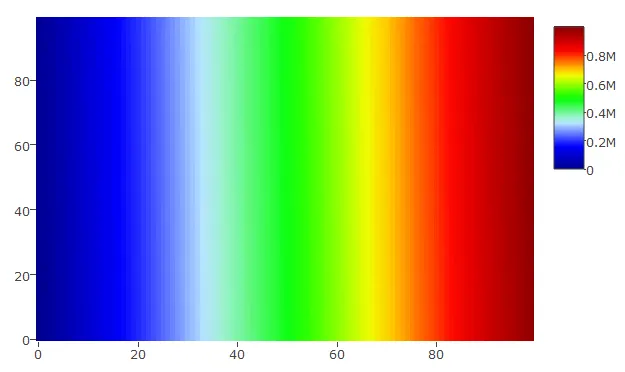
hmdata_s <- matrix(data = sort(sample(x = 1:10^6, size = 100*100)), nrow = 100, ncol = 100)
plot_ly(z = hmdata_s, colors = palette(50), type = "heatmap")
得到以下图表:
请告诉我这是否是您想要的。
更新
您可以在plot_ly中使用zauto、zmax和zmin设置自定义比例。以下两段代码和图表将说明此点:
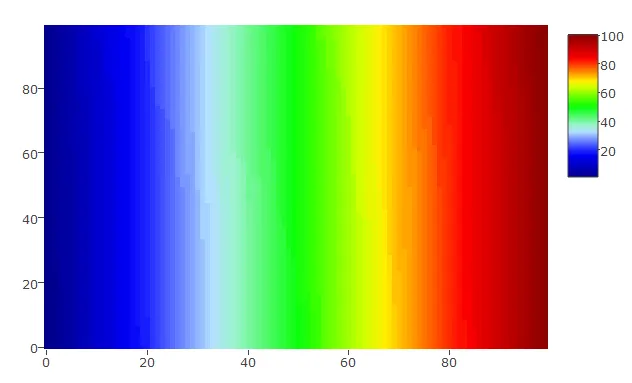
比例尺设置为1到100,数据变化类似:
hmdata_s3 <- matrix(data = sort(sample(x = 1:100, size = 100*100, replace = TRUE)), nrow = 100, ncol = 100)
plot_ly(z = hmdata_s3, colors = palette(50), type = "heatmap", zauto = FALSE, zmin = 1, zmax = 100)
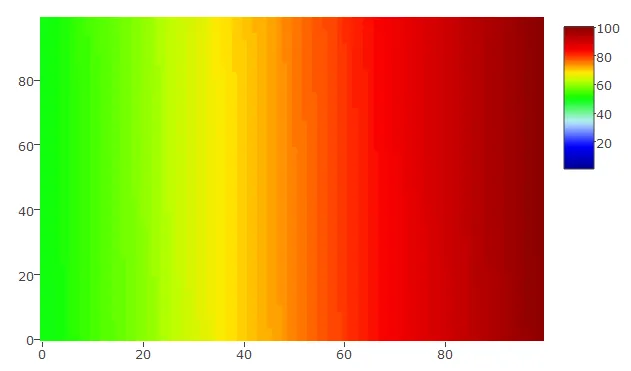
该比例尺设置为1到100,数据仅在50到100之间变化。
hmdata_s4 <- matrix(data = sort(sample(x = 50:100, size = 100*100, replace = TRUE)), nrow = 100, ncol = 100)
plot_ly(z = hmdata_s4, colors = palette(50), type = "heatmap", zauto = FALSE, zmin = 1, zmax = 100)