我正在使用Julia中的Gadfly绘制数据。 我有x =一组浮点数,以及几个匹配长度的y1、y2、y3等。如何在一个Gadfly图中将所有点(x,y1)绘制为绿色,(x,y2)绘制为红色,以此类推?
2个回答
7
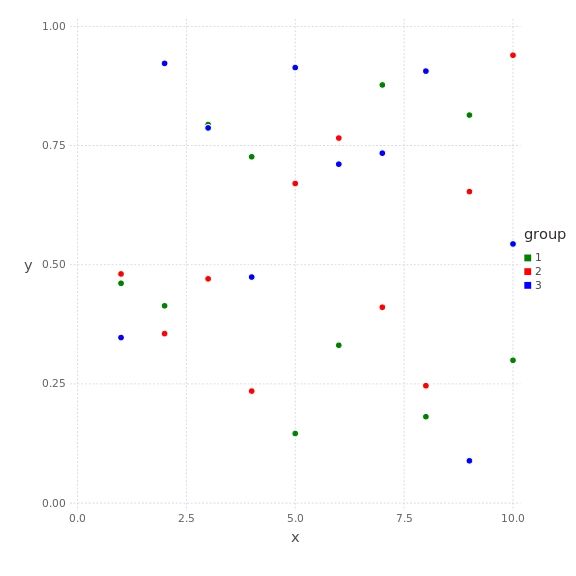
你可以将数据放入一个DataFrame中,有三列,
x,y和group,并使用group作为颜色美学。# Sample data
n = 10
x = collect(1:n)
y1 = rand(n)
y2 = rand(n)
y3 = rand(n)
# Put the data in a DataFrame
using DataFrames
d = DataFrame(
x = vcat(x,x,x),
y = vcat(y1,y2,y3),
group = vcat( rep("1",n), rep("2",n), rep("3",n) )
)
# Plot
using Gadfly
plot(
d,
x=:x, y=:y, color=:group,
Geom.point,
Scale.discrete_color_manual("green","red","blue")
)
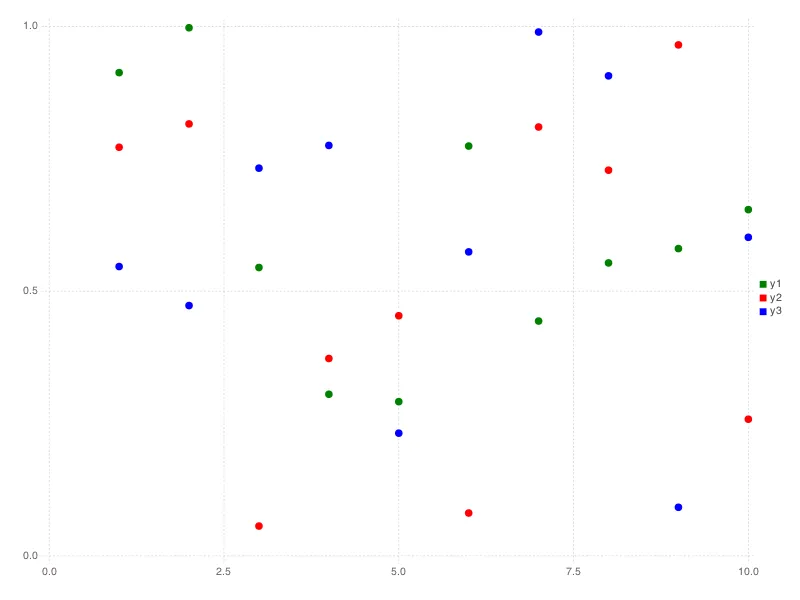
如评论中所建议的,您也可以使用层:
plot(
  layer(x=x, y=y1, Geom.point, Theme(default_color=color("green"))),
  layer(x=x, y=y2, Geom.point, Theme(default_color=color("red"))),
  layer(x=x, y=y3, Geom.point, Theme(default_color=color("blue")))
)
- Vincent Zoonekynd
2
3数据框架方法是实现你想要做的最简单的方法。但是,对于更复杂的图形,您还可以查看Gadfly的Layers。在单个绘图中创建多个层可以为更复杂的数据集实现相同的效果。 - Jeremy Wall
起初我尝试使用图层,但在尝试将不同的x、y放入每个图层时出现了错误。然而,我对Gadfly还很陌生,可能做错了几件事情。 - DarenW
0
这种东西使用我的软件包https://github.com/tbreloff/Plots.jl非常简单:
julia> using Plots; scatter(rand(10,3), c=[:green,:red,:blue])
- Tom Breloff
网页内容由stack overflow 提供, 点击上面的可以查看英文原文,
原文链接
原文链接