TikZ、调整大小和适应性问题

6
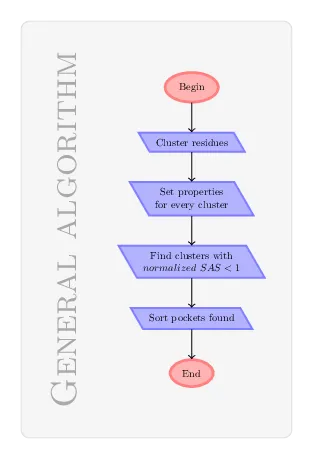
我希望获取一个PGF图片,将其缩小(同时缩小文字,因此使用\resizebox最为完美),以达到特定的高度,然后在图片左侧放置旋转文本,并创建包含所有内容的节点。
类似于这样: Algorithm example 
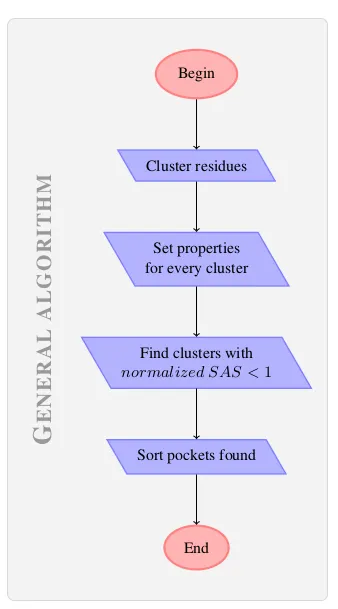
但是我希望能够设置图表的高度,而不需要缩小旋转的“标题”。
以下是此示例的LaTeX代码:
\documentclass{article}
\usepackage{tikz}
\usetikzlibrary{positioning,fit,shapes.geometric,backgrounds}

\begin{document}
\begin{tikzpicture}[%
  inner sep=2mm,
    delimiter/.style={ellipse, very thick, fill=red!30, draw=red!50},
    action/.style={trapezium, trapezium left angle=120, trapezium right angle=60, thick, fill=blue!30, draw=blue!50, align=center},
    loop/.style={ellipse, thick, fill=yellow!30, draw=yellow!50, align=center},
  title/.style={font=\LARGE\scshape,node distance=16pt, text=black!40, inner sep=1mm},
  background/.style={rectangle, rounded corners, fill=black!5, draw=black!15, inner sep=4mm}
]

  \node[delimiter] (begin) {Begin};
  \node[action] (cluster residues) [below=of begin] {Cluster residues};
  \node[action] (set clusters) [below=of cluster residues] {Set properties\\for every cluster};
  \node[action] (find pockets) [below=of set clusters] {Find clusters with\\$normalized\ SAS < 1$};
  \node[action] (sort pockets) [below=of find pockets] {Sort pockets found};
  \node[delimiter] (end) [below=of sort pockets] {End};

  \draw[->] (begin.south) -- (cluster residues);
  \draw[->] (cluster residues) -- (set clusters);
  \draw[->] (set clusters) -- (find pockets);
  \draw[->] (find pockets) -- (sort pockets);
  \draw[->] (sort pockets) -- (end);

  \node[fit=(begin)(cluster residues)(set clusters)(find pockets)(sort pockets)(end)] (chart) {};
  \node[title] (title) [left=of chart] {\rotatebox{90}{General algorithm}};

  \begin{scope}[on background layer]
    \node[background,fit=(chart)(title)] {};
  \end{scope}
\end{tikzpicture}
\end{document}

有没有关于如何使用\resizebox\adjustbox或其他方法来调整图表大小(而不是“General algorithm”标签)的想法?
1个回答

7
你可以将图表放入scope中,并使用scale选项调整其大小。注意transform shape选项。有关详细信息,请参见pgfmanual(第17.7节变换)。

enter image description here

\documentclass[border=10pt]{standalone}
\usepackage{tikz}
\usetikzlibrary{positioning,fit,shapes.geometric,backgrounds}

\begin{document}
\begin{tikzpicture}[%
  inner sep=2mm,
    delimiter/.style={ellipse, very thick, fill=red!30, draw=red!50},
    action/.style={trapezium, trapezium left angle=120, trapezium right angle=60, thick, fill=blue!30, draw=blue!50, align=center},
    loop/.style={ellipse, thick, fill=yellow!30, draw=yellow!50, align=center},
  title/.style={font=\LARGE\scshape,node distance=16pt, text=black!40, inner sep=1mm},
  background/.style={rectangle, rounded corners, fill=black!5, draw=black!15, inner sep=4mm}
]

  \begin{scope}[scale=0.5, transform shape]
      \node[delimiter] (begin) {Begin};
      \node[action] (cluster residues) [below=of begin] {Cluster residues};
      \node[action] (set clusters) [below=of cluster residues] {Set properties\\for every cluster};
      \node[action] (find pockets) [below=of set clusters] {Find clusters with\\$normalized\ SAS < 1$};
      \node[action] (sort pockets) [below=of find pockets] {Sort pockets found};
      \node[delimiter] (end) [below=of sort pockets] {End};

      \draw[->] (begin.south) -- (cluster residues);
      \draw[->] (cluster residues) -- (set clusters);
      \draw[->] (set clusters) -- (find pockets);
      \draw[->] (find pockets) -- (sort pockets);
      \draw[->] (sort pockets) -- (end);
  \end{scope}

  \node[fit=(begin)(cluster residues)(set clusters)(find pockets)(sort pockets)(end)] (chart) {};
  \node[title] (title) [left=of chart] {\rotatebox{90}{General algorithm}};

  \begin{scope}[on background layer]
    \node[background,fit=(chart)(title)] {};
  \end{scope}
\end{tikzpicture}
\end{document}

2
我知道我可以缩放范围和图片,但是,正如我所说,我需要设置最终高度。我“可以”自己计算比例,但这不是最优解,特别是如果我需要进行多次更改。 - dodomorandi

网页内容由stack overflow 提供, 点击上面的
可以查看英文原文,
原文链接