假设我有常规的笛卡尔坐标系$(x,y)$,并且我考虑一个矩形网格区域$D$(分成小正方形)。我想要看到在Python中如何将域$D$映射到坐标变换T:(x,y) -> (u(x,y) ,v(x,y) )下?
我需要像这样的东西:
我需要像这样的东西:
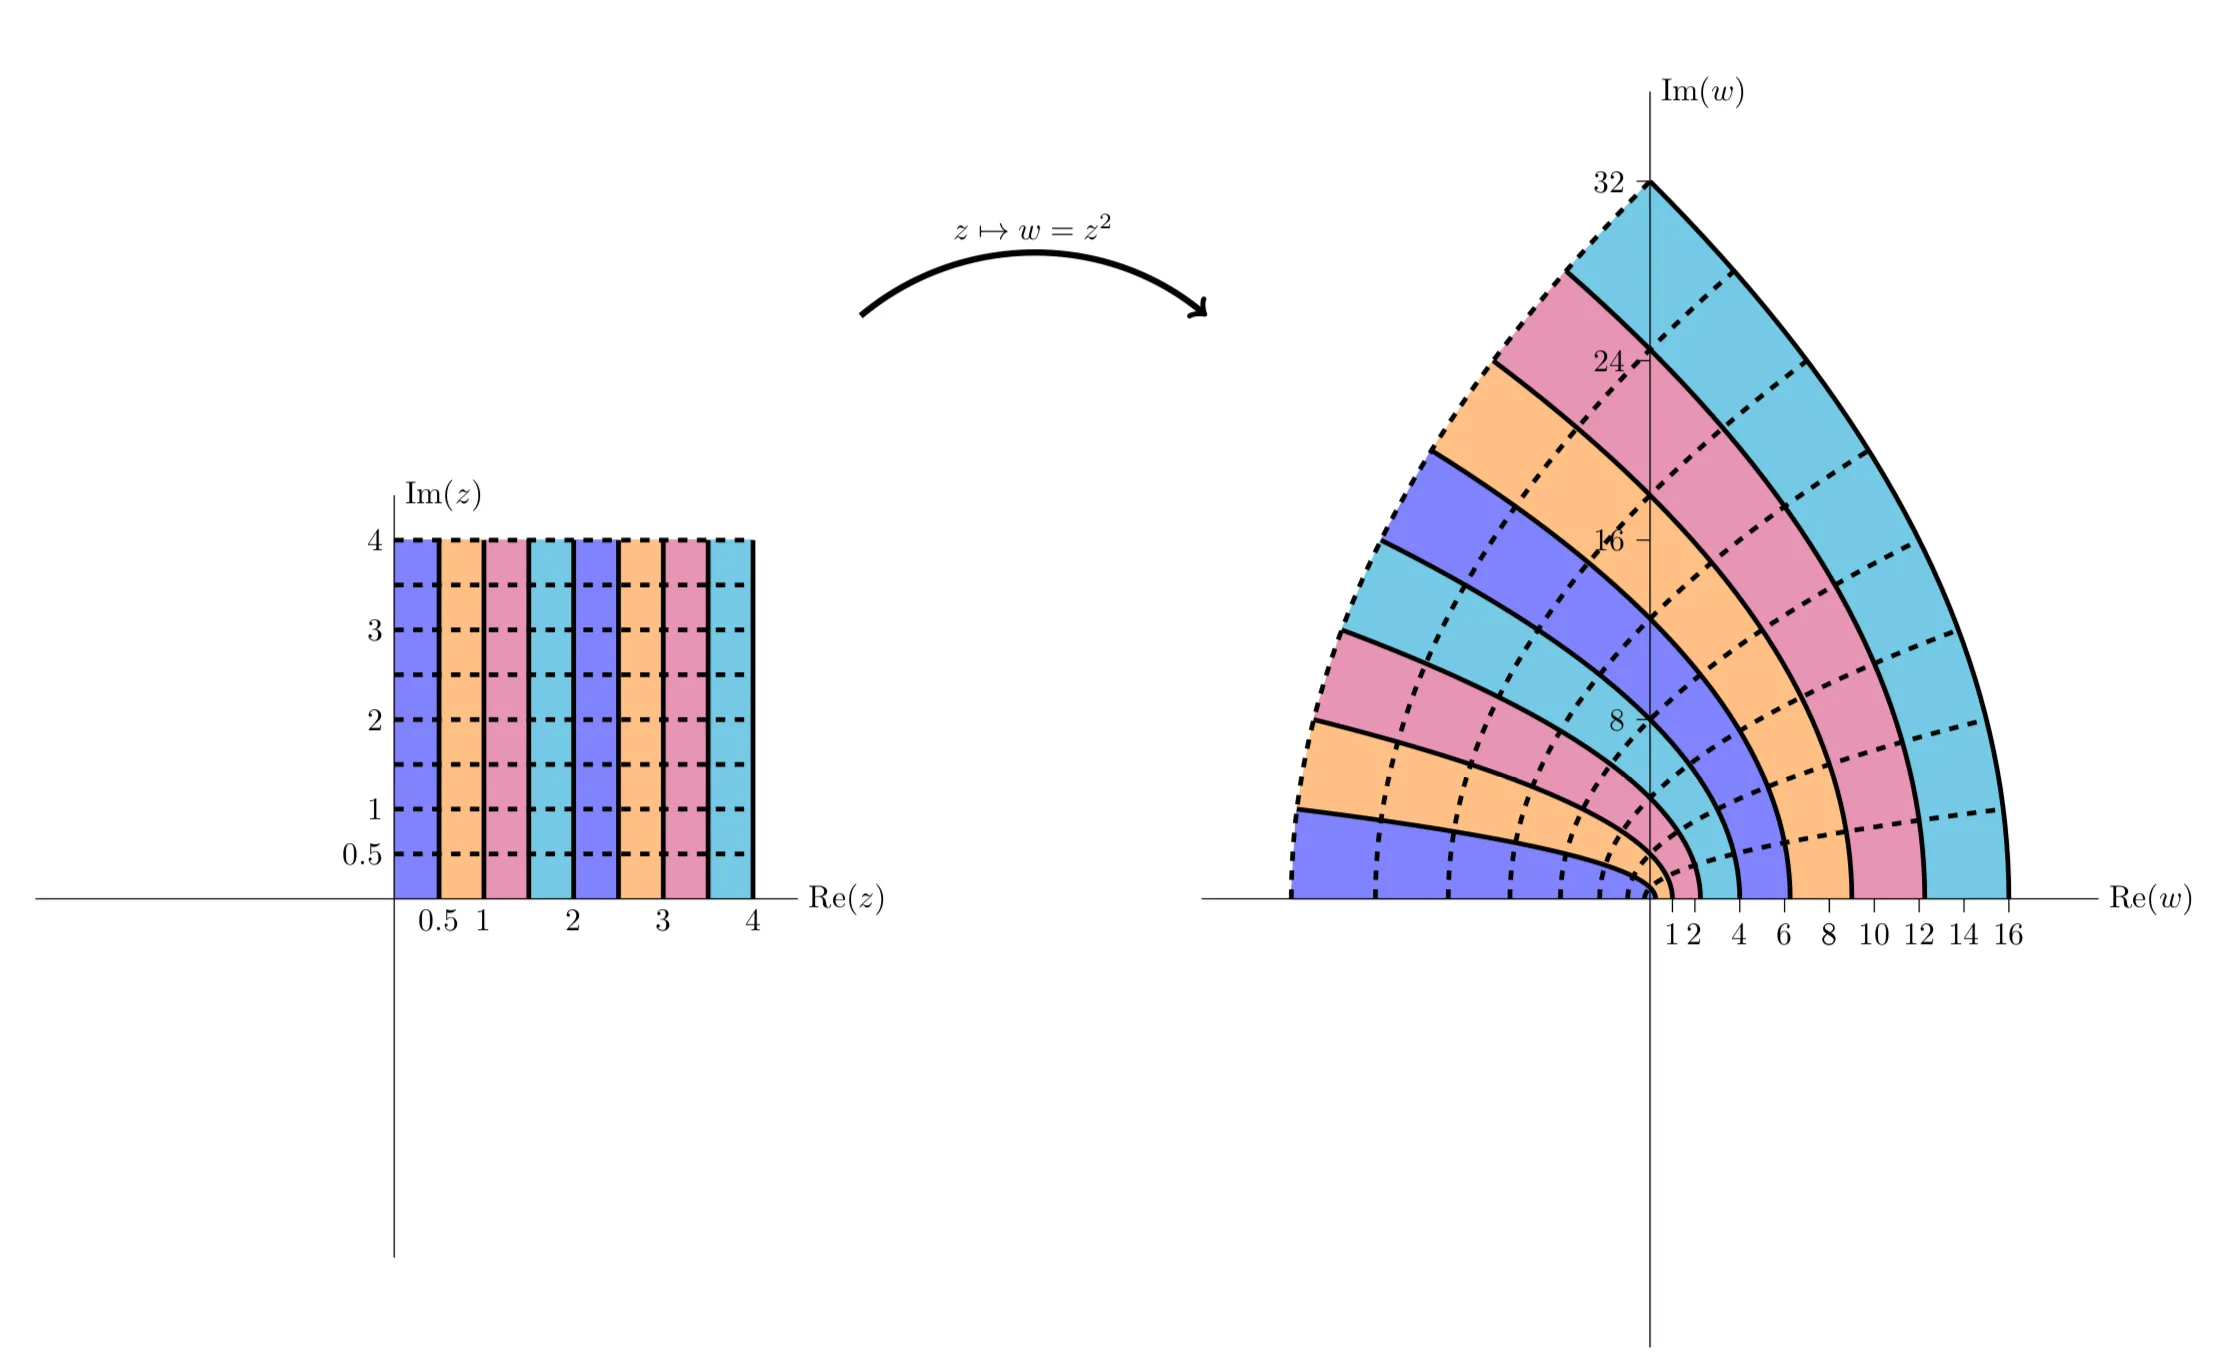
看这里。
我能得到一些建议吗?我是一个完全的 Python 和编程初学者。
看这里。
我能得到一些建议吗?我是一个完全的 Python 和编程初学者。
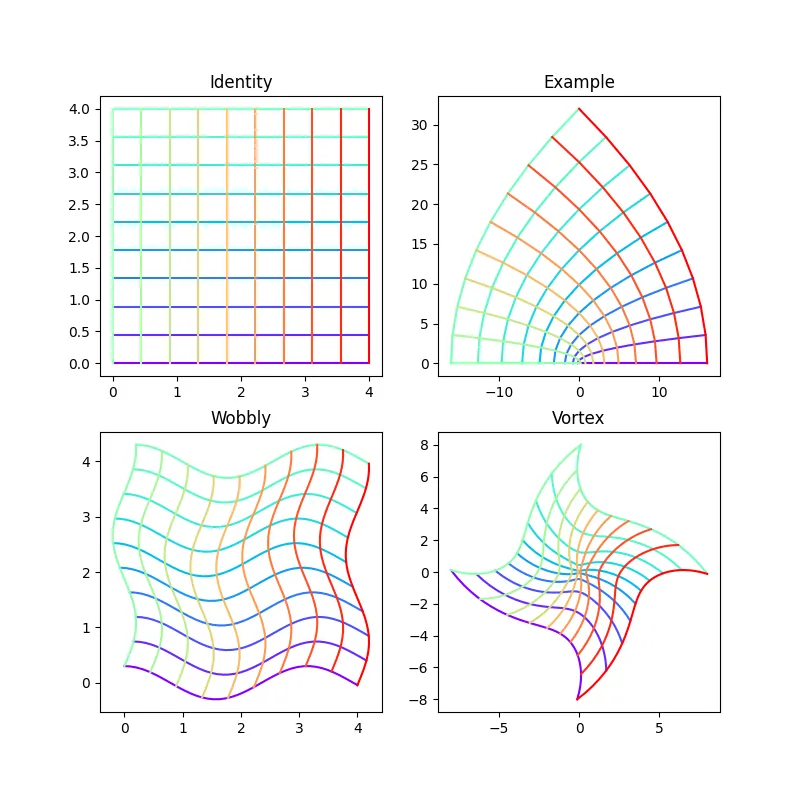
如果我理解你的意思正确,你想要看到一个转换后笛卡尔空间的类似网格的绘图?在这种情况下,也许可以使用Numpy和Matplotlib来做类似这样的事情。 (你也可以只用Pillow画一些线条,但是这更方便...)
编辑:根据评论中的讨论,与简单的原始版本(请参阅编辑历史记录)相比,我对此进行了一些修改,以便更容易绘制多个变换,并着色线条以便更容易跟踪它们如何被转换。尽管如此,它仍然相当简单。(为了好玩,我还添加了几个额外的变换。)
import math

import numpy as np
import matplotlib.pyplot as plt
from matplotlib import cm

colormap = cm.get_cmap("rainbow")


def plot_grid(
    xmin: float,
    xmax: float,
    ymin: float,
    ymax: float,
    n_lines: int,
    line_points: int,
    map_func,
):
    """
    Plot a transformation of a regular grid.

    :param xmin: Minimum x value
    :param xmax: Maximum x value
    :param ymin: Minimum y value
    :param ymax: Maximum y value
    :param n_lines: Number of lines per axis
    :param line_points: Number of points per line
    :param map_func: Function to map the grid points to new coordinates
    """
    # List for gathering the lines into.
    lines = []

    # Iterate over horizontal lines.
    for y in np.linspace(ymin, ymax, n_lines):
        lines.append([map_func(x, y) for x in np.linspace(xmin, xmax, line_points)])

    # Iterate over vertical lines.
    for x in np.linspace(xmin, xmax, n_lines):
        lines.append([map_func(x, y) for y in np.linspace(ymin, ymax, line_points)])

    # Plot all the lines.
    for i, line in enumerate(lines):
        p = i / (len(lines) - 1)  # Normalize to 0-1.
        # Transpose the list of points for passing to plot.
        xs, ys = zip(*line)
        # Get the line color from the colormap.
        plt.plot(xs, ys, color=colormap(p))


# Define some mapping functions.


def identity(x, y):
    return x, y


def example(x, y):
    c = complex(x, y) ** 2
    return (c.real, c.imag)


def wobbly(x: float, y: float):
    return x + math.sin(y * 2) * 0.2, y + math.cos(x * 2) * 0.3


def vortex(x: float, y: float):
    dst = (x - 2) ** 2 + (y - 2) ** 2
    ang = math.atan2(y - 2, x - 2)
    return math.cos(ang - dst * 0.1) * dst, math.sin(ang - dst * 0.1) * dst


# Set up the plot surface...
plt.figure(figsize=(8, 8))
plt.tight_layout()

plt.subplot(2, 2, 1)
plt.title("Identity")
plot_grid(0, 4, 0, 4, 10, 10, identity)

plt.subplot(2, 2, 2)
plt.title("Example")
plot_grid(0, 4, 0, 4, 10, 10, example)

plt.subplot(2, 2, 3)
plt.title("Wobbly")
plot_grid(0, 4, 0, 4, 10, 40, wobbly)

plt.subplot(2, 2, 4)
plt.title("Vortex")
plot_grid(0, 4, 0, 4, 10, 40, vortex)

plt.savefig("so71735261-2.png")
plt.show()
这并不是完全简单的。您需要学习如何使用绘图库来创建图形,例如matplotlib。您还需要弄清楚如何创建、离散化和转换常规网格。numpy库非常适用于此类操作。无论如何,我不确定这对于“完全初学者”来说是否是一个好问题。如果您完全不了解编程或Python,我建议从更简单的事情开始。