我试图使用Excel VBA循环绘制散点图,但是不知道如何实现。
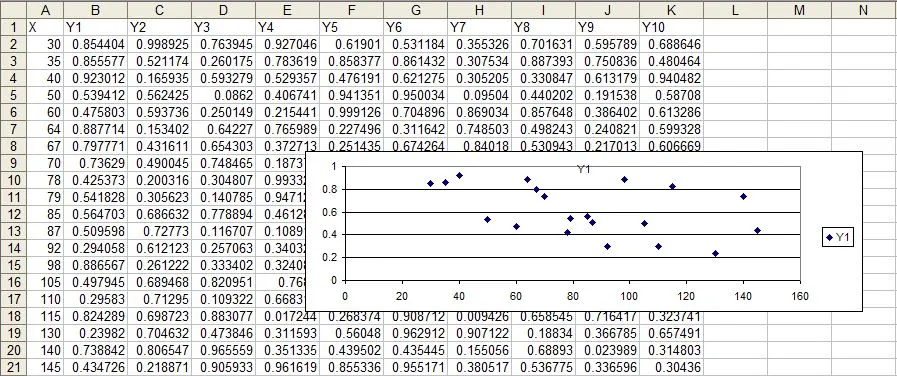
这是我使用RAND()函数填充Y序列生成的虚拟数据,并且下面的图片展示了一个示例图表。
以下是相应的代码:
Sub multichart()
    Range("A1:B21").Select
    Charts.Add
    ActiveChart.ChartType = xlXYScatter
    ActiveChart.SetSourceData Source:=Sheets("Sheet1").Range("A1:B21"), PlotBy _
        :=xlColumns
    ActiveChart.Location Where:=xlLocationAsObject, Name:="Sheet1"
    With ActiveChart
        .HasTitle = True
        .ChartTitle.Characters.Text = "Y1"
        .Axes(xlCategory, xlPrimary).HasTitle = False
        .Axes(xlValue, xlPrimary).HasTitle = False
    End With
    ActiveSheet.Shapes("Chart 6").ScaleHeight 0.61, msoFalse, msoScaleFromTopLeft
    ActiveChart.PlotArea.Select
    Selection.Top = 1
    Selection.Height = 106
    Selection.Height = 113
    With Selection.Border
        .ColorIndex = 16
        .Weight = xlThin
        .LineStyle = xlContinuous
    End With
    With Selection.Interior
        .ColorIndex = 2
        .PatternColorIndex = 1
        .Pattern = xlSolid
    End With
End Sub
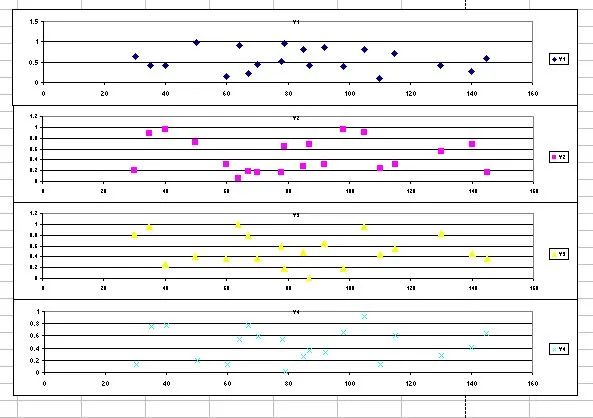
我希望可以循环执行此过程以创建N个图表(其中N是任何工作表中Y列的数量),这意味着每个工作表的变化不同。还需要将图表逐一追加。为了进行比较,所有绘图的Y和X限制应该是相同的。输出结果如下所示(仅展示4个变量):
 抱歉可能这是一个基础问题,因为我是Excel VBA的初学者。