我正在使用Bokeh库进行实时数据绘图的实验,这个库提供了方便的方法来完成这个任务。
下面是我用来实现这个任务的代码片段:
# do the imports
import pandas as pd
import numpy as np
import time
from bokeh.plotting import *
from bokeh.models import ColumnDataSource
# here is simulated fake time series data
ts = pd.date_range("8:00", "10:00", freq="5S")
ts.name = 'timestamp'
ms = pd.Series(np.arange(0, len(ts)), index=ts)
ms.name = 'measurement'
data = pd.DataFrame(ms)
data['state'] = np.random.choice(3, len(ts))
data['observation'] = np.random.choice(2, len(ts))
data.reset_index(inplace=True)
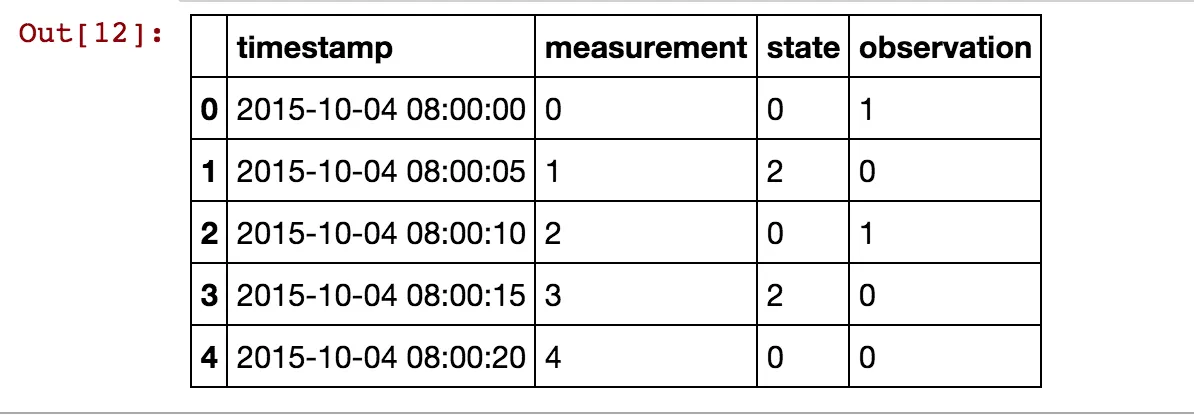
data.head()
这是数据的外观。
 接下来,我使用以下代码片段将数据实时推送到服务器。
output_server("observation")
p = figure(plot_width=800, plot_height=400, x_axis_type="datetime")
x = np.array(data.head(2).timestamp, dtype=np.datetime64)
y = np.array(data.head(2).observation)
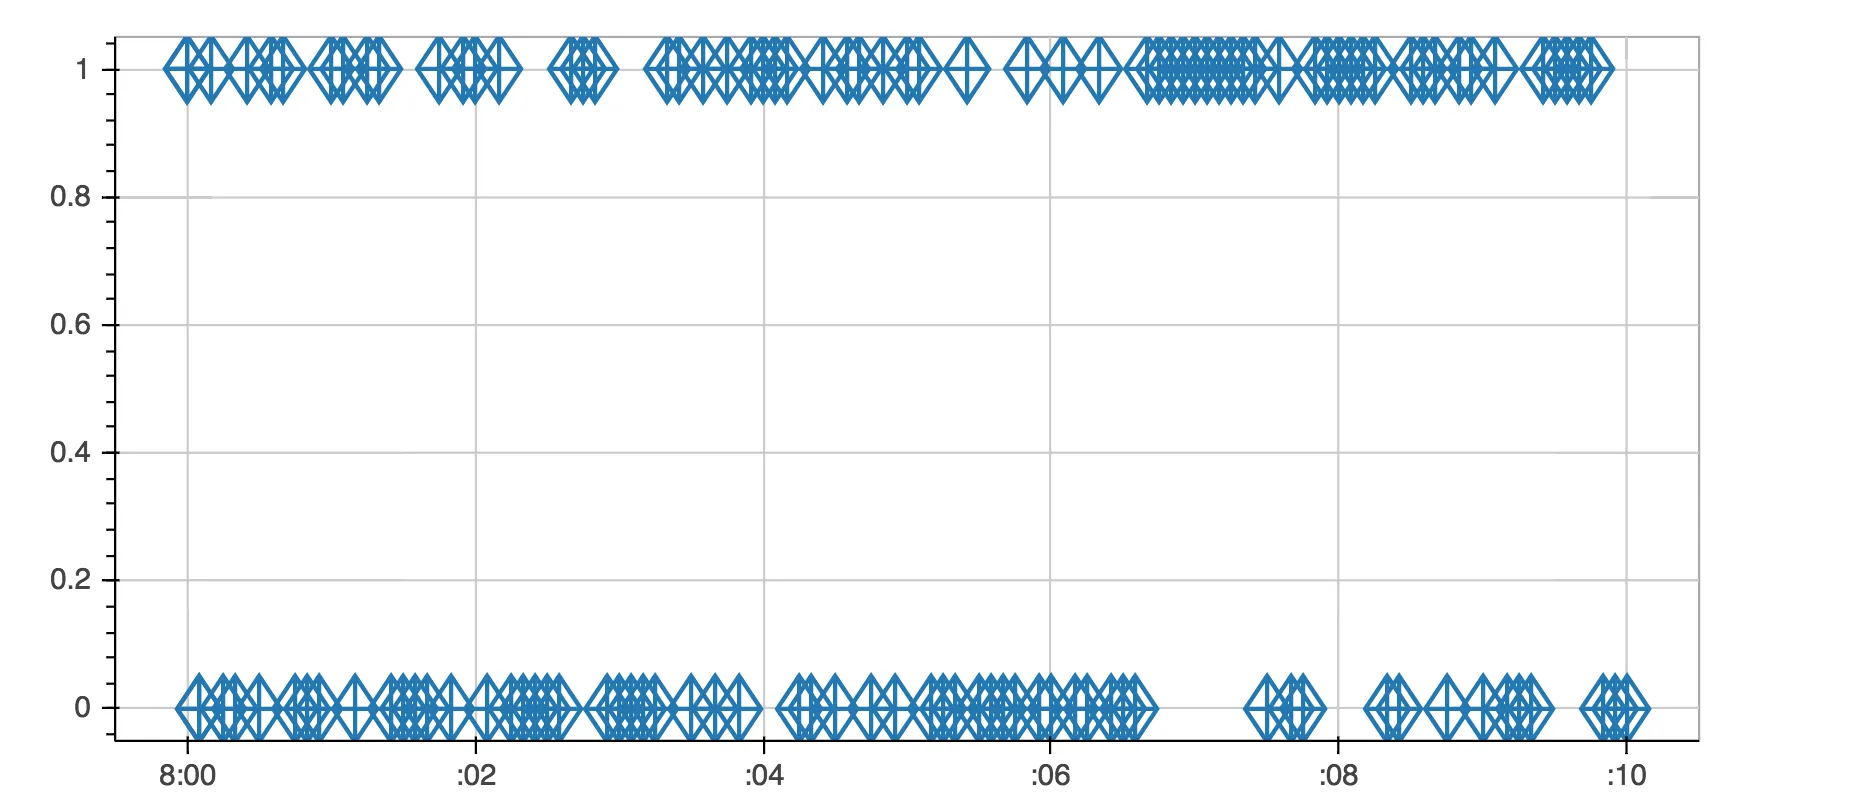
p.diamond_cross(x,y, size=30, fill_color=None, line_width=2, name='observation')
show(p)
renderer = p.select(dict(name="observation"))[0]
ds = renderer.data_source
for mes in range(len(data)):
x = np.append(x, np.datetime64(data.loc[mes].timestamp))
y = np.append(y, np.int64(data.loc[mes].observation))
ds.data["x"] = x
ds.data["y"] = y
ds._dirty = True
cursession().store_objects(ds)
time.sleep(.1)
这将产生一个非常好的结果,但是我需要根据一个值来改变每个数据点的颜色。
在这种情况下,条件是状态变量,它有三个取值 - 0、1和2。因此,我的数据应该能够反映出这一点。 我花了几个小时试图弄清楚它(我承认我对Bokeh非常陌生),任何帮助都将不胜感激。