在Spring框架中,是否可以自动记录方法所需的时间(选择性或全部)。我指的是自动地,而不是要去每个方法里写log.debug("...")。
5个回答
17
AOP是您在此处需要的。AOP允许您在不修改原始代码的情况下向应用程序添加代码。Spring AOP更喜欢使用代理对象来实现这一点。代理对象使用装饰器模式来包装原始目标对象并添加代码。代理已配置为实现一个或多个原始目标对象的接口。
在这里,为了计时应用程序,想法是使用
第一种选择是使用Spring类
在这里,为了计时应用程序,想法是使用
PerformanceMonitorInterceptor之一,它是与Spring Framework一起提供的性能监视类之一。第一种选择是使用Spring类
ProxyFactoryBean创建Spring AOP代理对象。要做到这一点:
- 定义您的原始bean:
- 定义一个
PerformanceMonitorInterceptor: - 定义一个
RegexpMethodPointcutAdvisor: - 定义一个
ProxyFactoryBean来代理您的原始bean并应用您的Advisor - 将
PerformanceMonitorInterceptor的日志级别设置为TRACE
<beans>
  <bean id="MyServiceTarget" class="org.myapp.services.MyService">
    <property ... />
  </bean>

  <bean id="timingLogger" class="org.springframework.aop.interceptor.PerformanceMonitorInterceptor"/>

  <bean id="timingAdvisor" class="org.springframework.aop.support.RegexpMethodPointcutAdvisor">
    <property name="advice" ref="timingLogger"/>
    <property name="patterns">
      <list>
        <value>.*</value>
      </list>
    </property>
  </bean>

  <bean id="MyService" class="org.springframework.aop.framework.ProxyFactoryBean">
    <property name="proxyInterfaces">
      <value>org.myapp.services.MyService</value>
    </property>
    <property name="target"><ref local="MyServiceTarget"/></property>
    <property name="interceptorNames">
      <list>
        <value>timingAdvisor</value>
      </list>
    </property>
  </bean>
</beans>
同时,需要配置PerformanceMonitorInterceptor的日志级别:
log4j.logger.org.springframework.aop.interceptor.PerformanceMonitorInterceptor=TRACE
从Spring 2.0开始,还有另一种选择:使用基于Spring 2.0 XML模式的配置和Spring的AspectJ风格的切入点表达式。使用ProxyFactoryBean,您必须明确声明要代理的接口;使用<aop:config>和<aop:advisor>标签,您可以自动代理bean容器中每个对象的每个接口。
<beans "add xsd declarations here" >
  <bean id="MyService" class="org.myapp.services.MyService">
    <property ... />
  </bean>

  <bean id="timingAdvice"
class="org.springframework.aop.interceptor.PerformanceMonitorInterceptor"/>

  <aop:config>
    <aop:advisor pointcut="execution(* org.myapp.services.MyService.*(..))"
      advice-ref="timingAdvice"/>
  </aop:config>
</beans>
- Pascal Thivent
4
4
你可以查看stagemonitor,它是一个开源的Java Web应用程序性能监视器。它捕获响应时间指标、JVM指标、请求详细信息(包括由请求分析器捕获的调用堆栈)等等。开销非常低。
可选地,您可以使用伟大的时序数据库graphite来存储长时间的数据点,以便您可以通过精美的仪表板查看。
示例截图: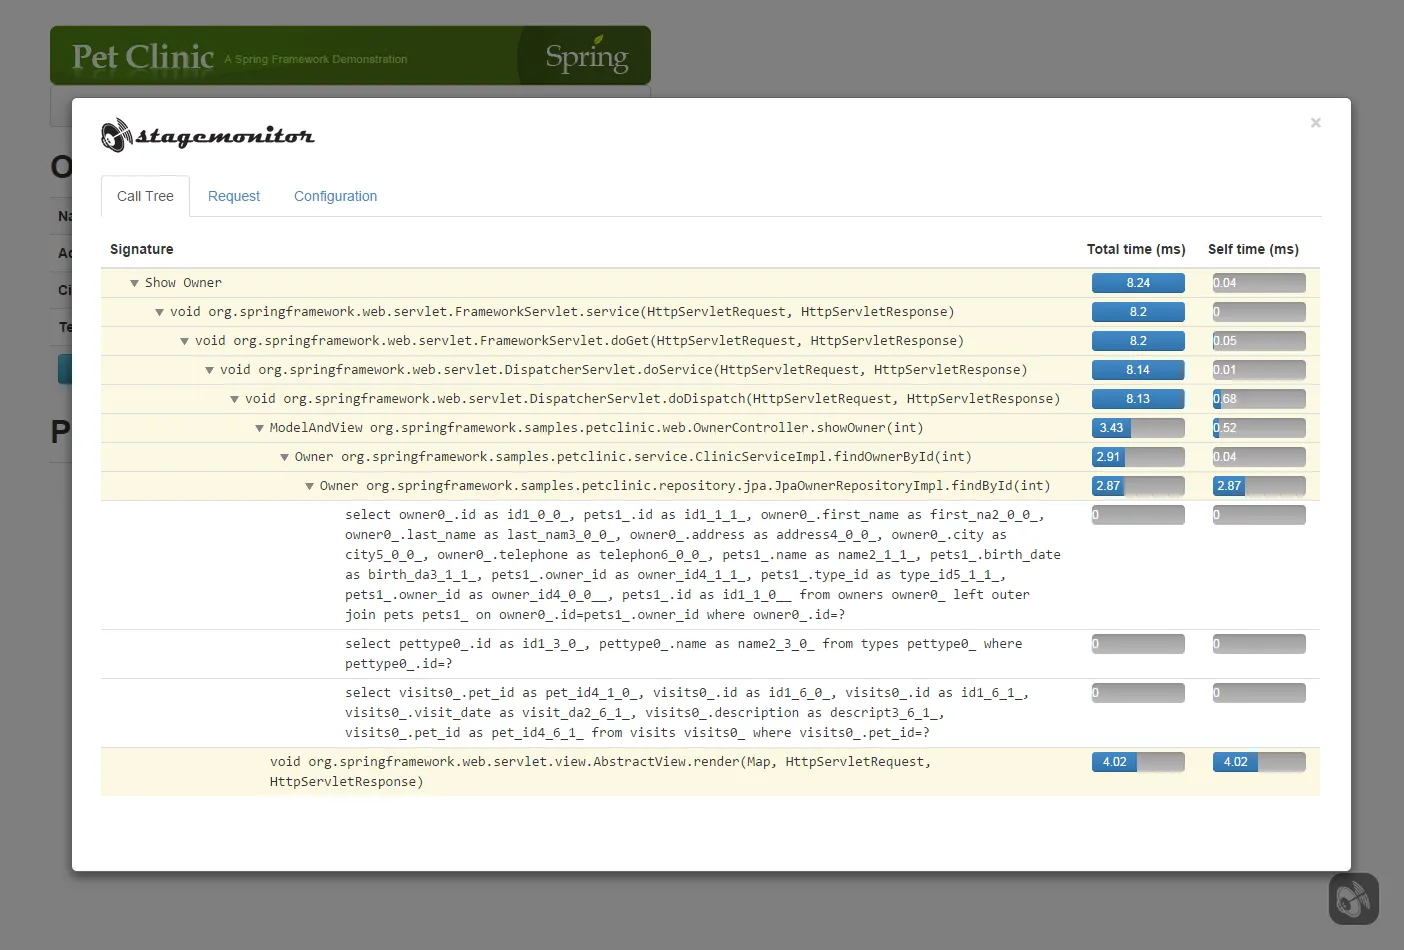 请查看项目网站以查看更多截图、功能描述和文档。
注意:我是stagemonitor的开发人员。
可选地,您可以使用伟大的时序数据库graphite来存储长时间的数据点,以便您可以通过精美的仪表板查看。
示例截图:
请查看项目网站以查看更多截图、功能描述和文档。注意:我是stagemonitor的开发人员。
- Felix
2
最终我弄明白了如何做到这一点。
首先查看 'Pascal Thivent' 的帖子,它对我有很大帮助。在更改您的log4j.properties并创建timingAdvisor之后,您需要将此顾问绑定到要启用调试的类上。您需要像这样更改您的代码。
原始代码:
<bean id="myTableDao" class="com.xyz.sc.db.dao.MyTableDaoImpl" parent="commonDataSource" >
            <property name="anotherDao" ref="anotherDao"/>
    </bean>
新代码。
<bean id="myTableDaoTarget" class="com.xyz.sc.db.dao.MyTableDaoImpl" parent="commonDataSource" >
        <property name="anotherDao" ref="anotherDao"/>
</bean>


    <bean id="myTableDao" class="org.springframework.aop.framework.ProxyFactoryBean">
    <property name="proxyInterfaces">
        <value>com.xyz.sc.db.dao.MyTableDao</value>
    </property>
    <property name="target"><ref local="myTableDaoTarget"/></property>
    <property name="interceptorNames">
        <list>
            <value>timingAdvisor</value>
        </list>
    </property>
</bean>
- Rakesh Juyal
1
我看到这里已经有一个被接受的答案了,但我鼓励大家去看一下Spring Toolsuite(SpringSource的Eclipse发行版)的最新版本。它自带一个分析工具,Spring Insight,在运行时以漂亮的格式提供这些精确的统计数据。只需将您的应用程序部署到其内部tomcat,访问几个页面,然后转到/insight servlet,查看每个调用方法所花费的时间,一直到执行的SQL语句及其所花费的时间。
这里是一个关于Spring Insight的不错的介绍文章,只需几分钟即可获得您想要的内容。http://www.dotkam.com/2009/10/28/spring-insight-in-action-5-minutes-from-scratch/
- user222621
网页内容由stack overflow 提供, 点击上面的可以查看英文原文,
原文链接
原文链接
ProxyFactoryBean代理Spring beans。 - Pascal Thivent