我正在使用SVG创建一个仪表盘。
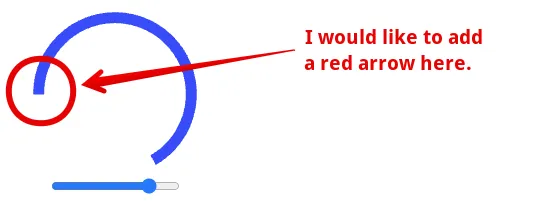
有没有办法在动画仪表盘的末尾添加一个箭头来指示输入的值?
由于仪表盘是使用路径的stroke-dasharray显示的,根据SVG规范,似乎无法应用标记。
如果这不可能,请告知是否有其他的选择。
有没有办法在动画仪表盘的末尾添加一个箭头来指示输入的值?
由于仪表盘是使用路径的stroke-dasharray显示的,根据SVG规范,似乎无法应用标记。
class arcGauge {
    constructor(targetEl) {
        this.el = targetEl;
        this.minmax = [];
        this.arcCoordinate = [];
        this.valueArcDataValue = 0;
        this.gaugeArc = document.createElementNS('http://www.w3.org/2000/svg', 'path');
    }

    // draw gauge
    init(data) {
        // set data
        this.viewBox = [0, 0, 110, 100];
        this.minmax = data.minmax || [];
        this.arcCoordinate = data.arcCoordinate || [120, 60];
        this.threshold = data.threshold || [];
        this.valueArcData = data.valueArcData;
        this.gaugeRadius = 42;
        this.gaugeStrokeWidth = 6;

        this._makeGauge();

    }

    _makeGauge() {
        const radius = this.gaugeRadius;

        let arcCoord = [];
        // coordinate
        this.arcCoordinate.forEach((ang) => {
            const radian = this._degreesToRadians(ang);
            const x = this.viewBox[2] / 2 + Math.cos(radian) * radius;
            const y = this.viewBox[2] / 2 + Math.sin(radian) * radius;
            arcCoord.push([x.toFixed(2), y.toFixed(2)]);
        });

        //arc
        this.gaugeArc.setAttribute('id', 'gaugeArc');
        this.gaugeArc.setAttribute('d', `M ${arcCoord[0][0]} ${arcCoord[0][1]} A ${radius} ${radius} 0 1 1  ${arcCoord[1][0]} ${arcCoord[1][1]}`);
        this.gaugeArc.setAttribute('fill', 'none');
        this.gaugeArc.setAttribute('stroke', this.valueArcData.color);
        this.gaugeArc.setAttribute('stroke-width', this.gaugeStrokeWidth);
        this.gaugeArc.setAttribute('transform', 'scale(-1, 1) translate(-110, 0)');

        let percentage = 0;
    percentage = this.valueArcData.value;

        this.gaugeArc.style.strokeDasharray = this._getArcLength(radius, 300, percentage);

        this.el.appendChild(this.gaugeArc);
    }

    // degree
    _degreesToRadians(degrees) {
        const pi = Math.PI;
        return degrees * (pi / 180);
    }
    // arc length
    _getArcLength(radius, degrees, val) {
        const radian = this._degreesToRadians(degrees);
        const arcLength = 2 * Math.PI * radius * (degrees / 360);
        const pathLength = arcLength * (val / 100);
        const dasharray = `${pathLength.toFixed(2)} ${arcLength.toFixed(2)}`;
        return dasharray;
    }


    // set gauge value
    setValue(v) {
            const baseValue = this.minmax[1] - this.minmax[0];
            const percentage = (v / baseValue) * 100;
            this.valueArcData.value = v;

            this.gaugeArc.style.strokeDasharray = this._getArcLength(this.gaugeRadius, 300, percentage);
            //gauge animation
            this.gaugeArc.style.transition = 'stroke-dasharray 1s ease-in-out';
    }

}


const arcGaugeData = {
  minmax: [0, 100],
  thresholdColor: ['#22b050', '#f4c141', '#e73621'],
  valueArcData: { type: 'arrow', color: '#3e3eff', value: 80 },
};
const arcGaugeIns = new arcGauge(document.querySelector('#chart'));
arcGaugeIns.init(arcGaugeData);

function changeArc(ipt) {
  arcGaugeIns.setValue(ipt.value);
}
.container {
display: flex;
flex-direction: column;
align-items: center;
justify-content: center;
width: 100%;
height: 100%;
}<div class="container">
<svg id="chart" xmlns="http://www.w3.org/2000/svg" width="180px" height="auto" viewBox="0 0 110 100"></svg>
<input type="range" min="0" max="100" step="1" value="80" onchange="changeArc(this)" />
</div>
<marker>标记 https://developer.mozilla.org/zh-CN/docs/Web/SVG/Element/marker - undefined