如何使用ggtern包在三角图的轴上添加标签?
3
- R June
1
我在最新版本中添加了一个新的几何图形,以使这种类型的事情变得更容易,可以查看:geom_text_viewport和geom_label_viewport,http://www.ggtern.com/2017/07/23/version-2-2-1-released/。您仍然需要抑制掩码或将其放置在文本层下方,但是这两个几何图形更直观地放置标签相对于视口的x和y笛卡尔[0,1]限制。 - Nicholas Hamilton
2个回答
2
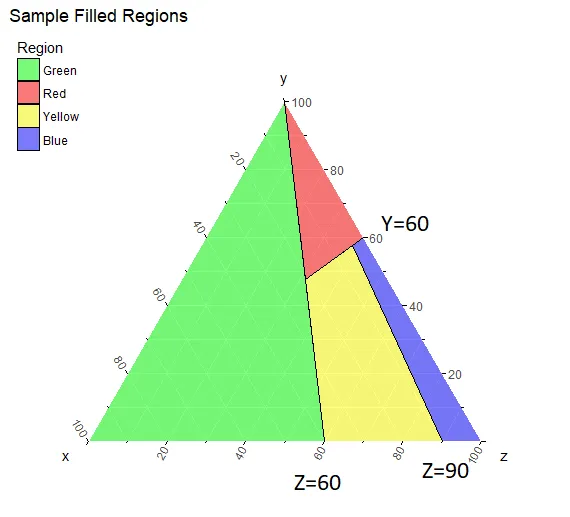
一种相对“原始”的解决方案是使用grobs。
在找到包含x、y和z标签的文本grobs(最初放置在三角形的顶点)后,我们将每个标签移动到所需位置。
library(ggtern)
library(grid)
g <- data.frame(y=c(1,0,0),
x=c(0,1,.4),
z=c(0,0,.6), Series="Green")
p <- data.frame(y=c(1,0.475,0.6),
x=c(0,0.210,0),
z=c(0,0.315,.4), Series="Red")
q <- data.frame(y=c(0.575,0.475,0.0,0.0),
x=c(0.040,0.210,0.4,0.1),
z=c(0.385,0.315,0.6,0.9), Series="Yellow")
f <- data.frame(y=c(0.6,0.575,0.0,0.0),
x=c(0.0,0.040,0.1,0.0),
z=c(0.4,0.385,0.9,1.0), Series="Blue")
DATA = rbind(g, p, q, f)
p <- ggtern(data=DATA,aes(x,y,z)) +
geom_polygon(aes(fill=Series),alpha=.5,color="black",size=0.25) +
scale_fill_manual(values=as.character(unique(DATA$Series))) +
theme(legend.position=c(0,1),legend.justification=c(0,1)) +
labs(fill="Region",title="Sample Filled Regions")+
xlab("X=60")+ylab("Y=60")+zlab("Z=90")
gt <- ggplot_gtable(ggplot_build(p))
grobPanel <- gt$grobs[[which(gt$layout$name == "panel")]]
grobLabels <- grobPanel$children[[length(grobPanel$children)]]
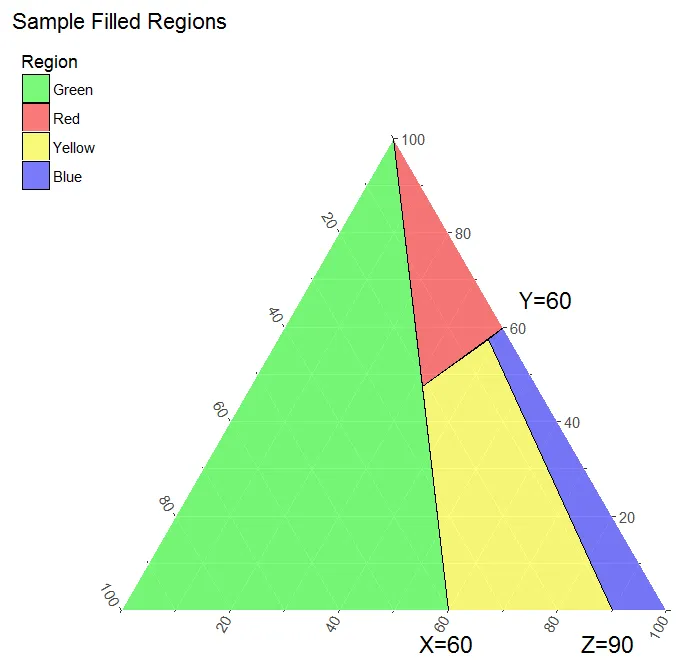
# X-axes label
gt$grobs[[which(gt$layout$name == "panel")]]$children[[length(grobPanel$children)]]$children[[2]]$x <- unit(0.6,"npc")
gt$grobs[[which(gt$layout$name == "panel")]]$children[[length(grobPanel$children)]]$children[[2]]$y <- unit(0.1,"npc")
gt$grobs[[which(gt$layout$name == "panel")]]$children[[length(grobPanel$children)]]$children[[2]]$gp$fontsize <- 14
# Y-axes label
gt$grobs[[which(gt$layout$name == "panel")]]$children[[length(grobPanel$children)]]$children[[1]]$x <- unit(0.7,"npc")
gt$grobs[[which(gt$layout$name == "panel")]]$children[[length(grobPanel$children)]]$children[[1]]$y <- unit(0.6,"npc")
gt$grobs[[which(gt$layout$name == "panel")]]$children[[length(grobPanel$children)]]$children[[1]]$gp$fontsize <- 14
# Z-axes label
gt$grobs[[which(gt$layout$name == "panel")]]$children[[length(grobPanel$children)]]$children[[3]]$x <- unit(0.75,"npc")
gt$grobs[[which(gt$layout$name == "panel")]]$children[[length(grobPanel$children)]]$children[[3]]$y <- unit(0.1,"npc")
gt$grobs[[which(gt$layout$name == "panel")]]$children[[length(grobPanel$children)]]$children[[3]]$gp$fontsize <- 14
grid.draw(gt)
- Marco Sandri
2
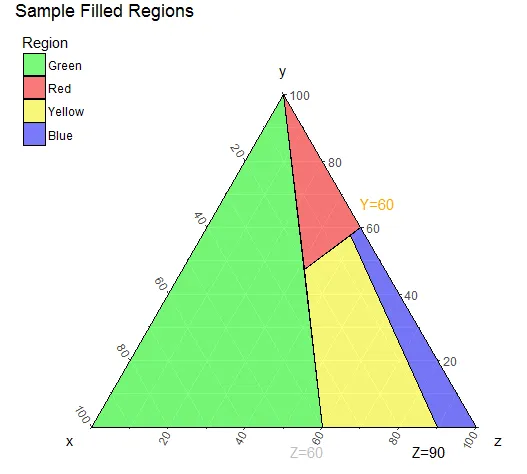
这不是最完美的答案,但我尝试使用annotate来实现您想要的结果,就像这样:
ggtern(data=DATA,aes(x,y,z)) +
  geom_polygon(aes(fill=Series),alpha=.5,color="black",size=0.25) +
  scale_fill_manual(values=as.character(unique(DATA$Series))) +
  theme(legend.position=c(0,1),legend.justification=c(0,1)) +
  labs(fill="Region",title="Sample Filled Regions") +
  annotate(geom  = 'text',
           x     = c(0.1, 1/3, 0.0),
           y     = c(0.0, 0.0, 1.5),
           z     = c(0.5, 1/3, 1.0),
           angle = c(0, 0, 0),
           vjust = c(2.5, 2.5, -1.5),
           hjust = c(0.0, -0.2, 0.0),
           label = c("Z=90","Z=60","Y=60"),
           color = c("black","gray",'orange')) + # for inspection
  theme_nomask()   # allows drawing beyond the borders
这将产生以下图片:
- KoenV
网页内容由stack overflow 提供, 点击上面的可以查看英文原文,
原文链接
原文链接