我有这段简单的代码:
clf = tree.DecisionTreeClassifier()
clf = clf.fit(X, y)

tree.plot_tree(clf.fit(X, y))
plt.show()
我得到的结果是这个图表:
如何使这个图表更易读? 我正在使用 PyCharm Professional 2019.3 作为我的 IDE。
我有这段简单的代码:
clf = tree.DecisionTreeClassifier()
clf = clf.fit(X, y)
tree.plot_tree(clf.fit(X, y))
plt.show()
我得到的结果是这个图表:
如何使这个图表更易读? 我正在使用 PyCharm Professional 2019.3 作为我的 IDE。
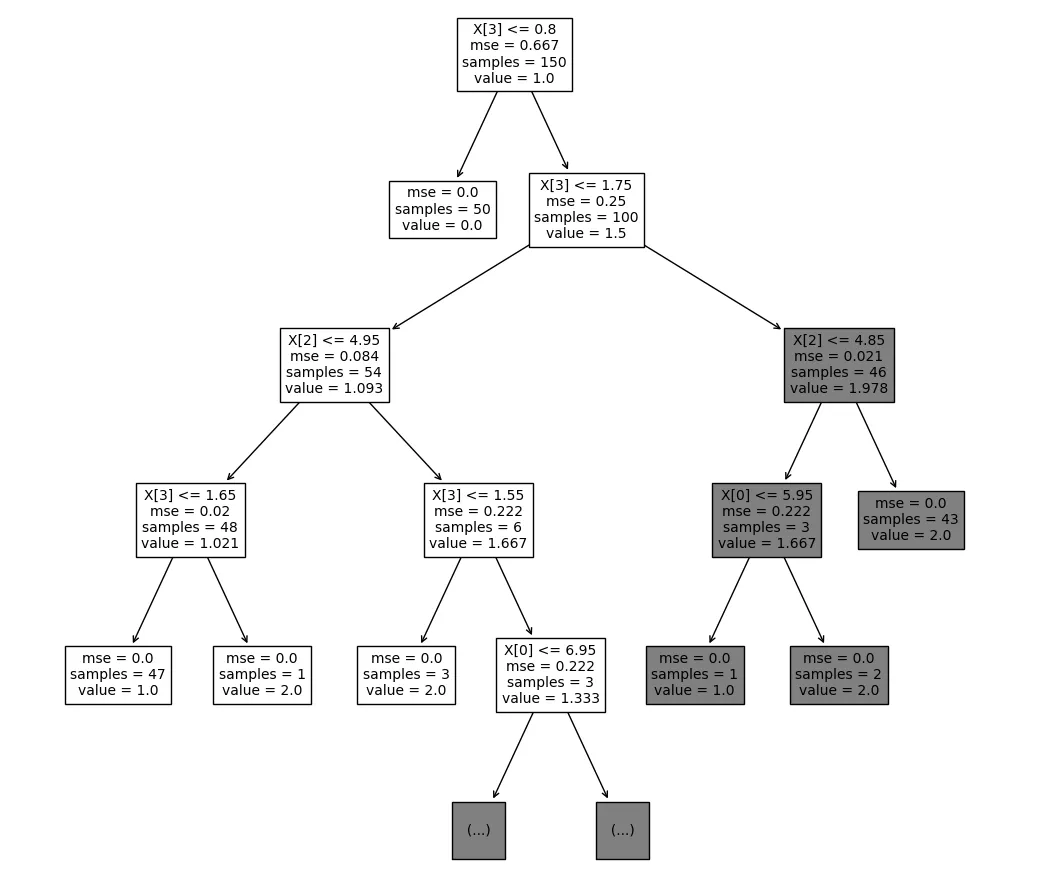
我认为您要查找的设置是fontsize。为了获得可读的图表,您需要平衡它与max_depth和figsize。这是一个例子。
from sklearn import tree
from sklearn.datasets import load_iris
import matplotlib.pyplot as plt

# load data
X, y = load_iris(return_X_y=True)

# create and train model
clf = tree.DecisionTreeClassifier(max_depth=4)  # set hyperparameter
clf.fit(X, y)

# plot tree
plt.figure(figsize=(12,12))  # set plot size (denoted in inches)
tree.plot_tree(clf, fontsize=10)
plt.show()
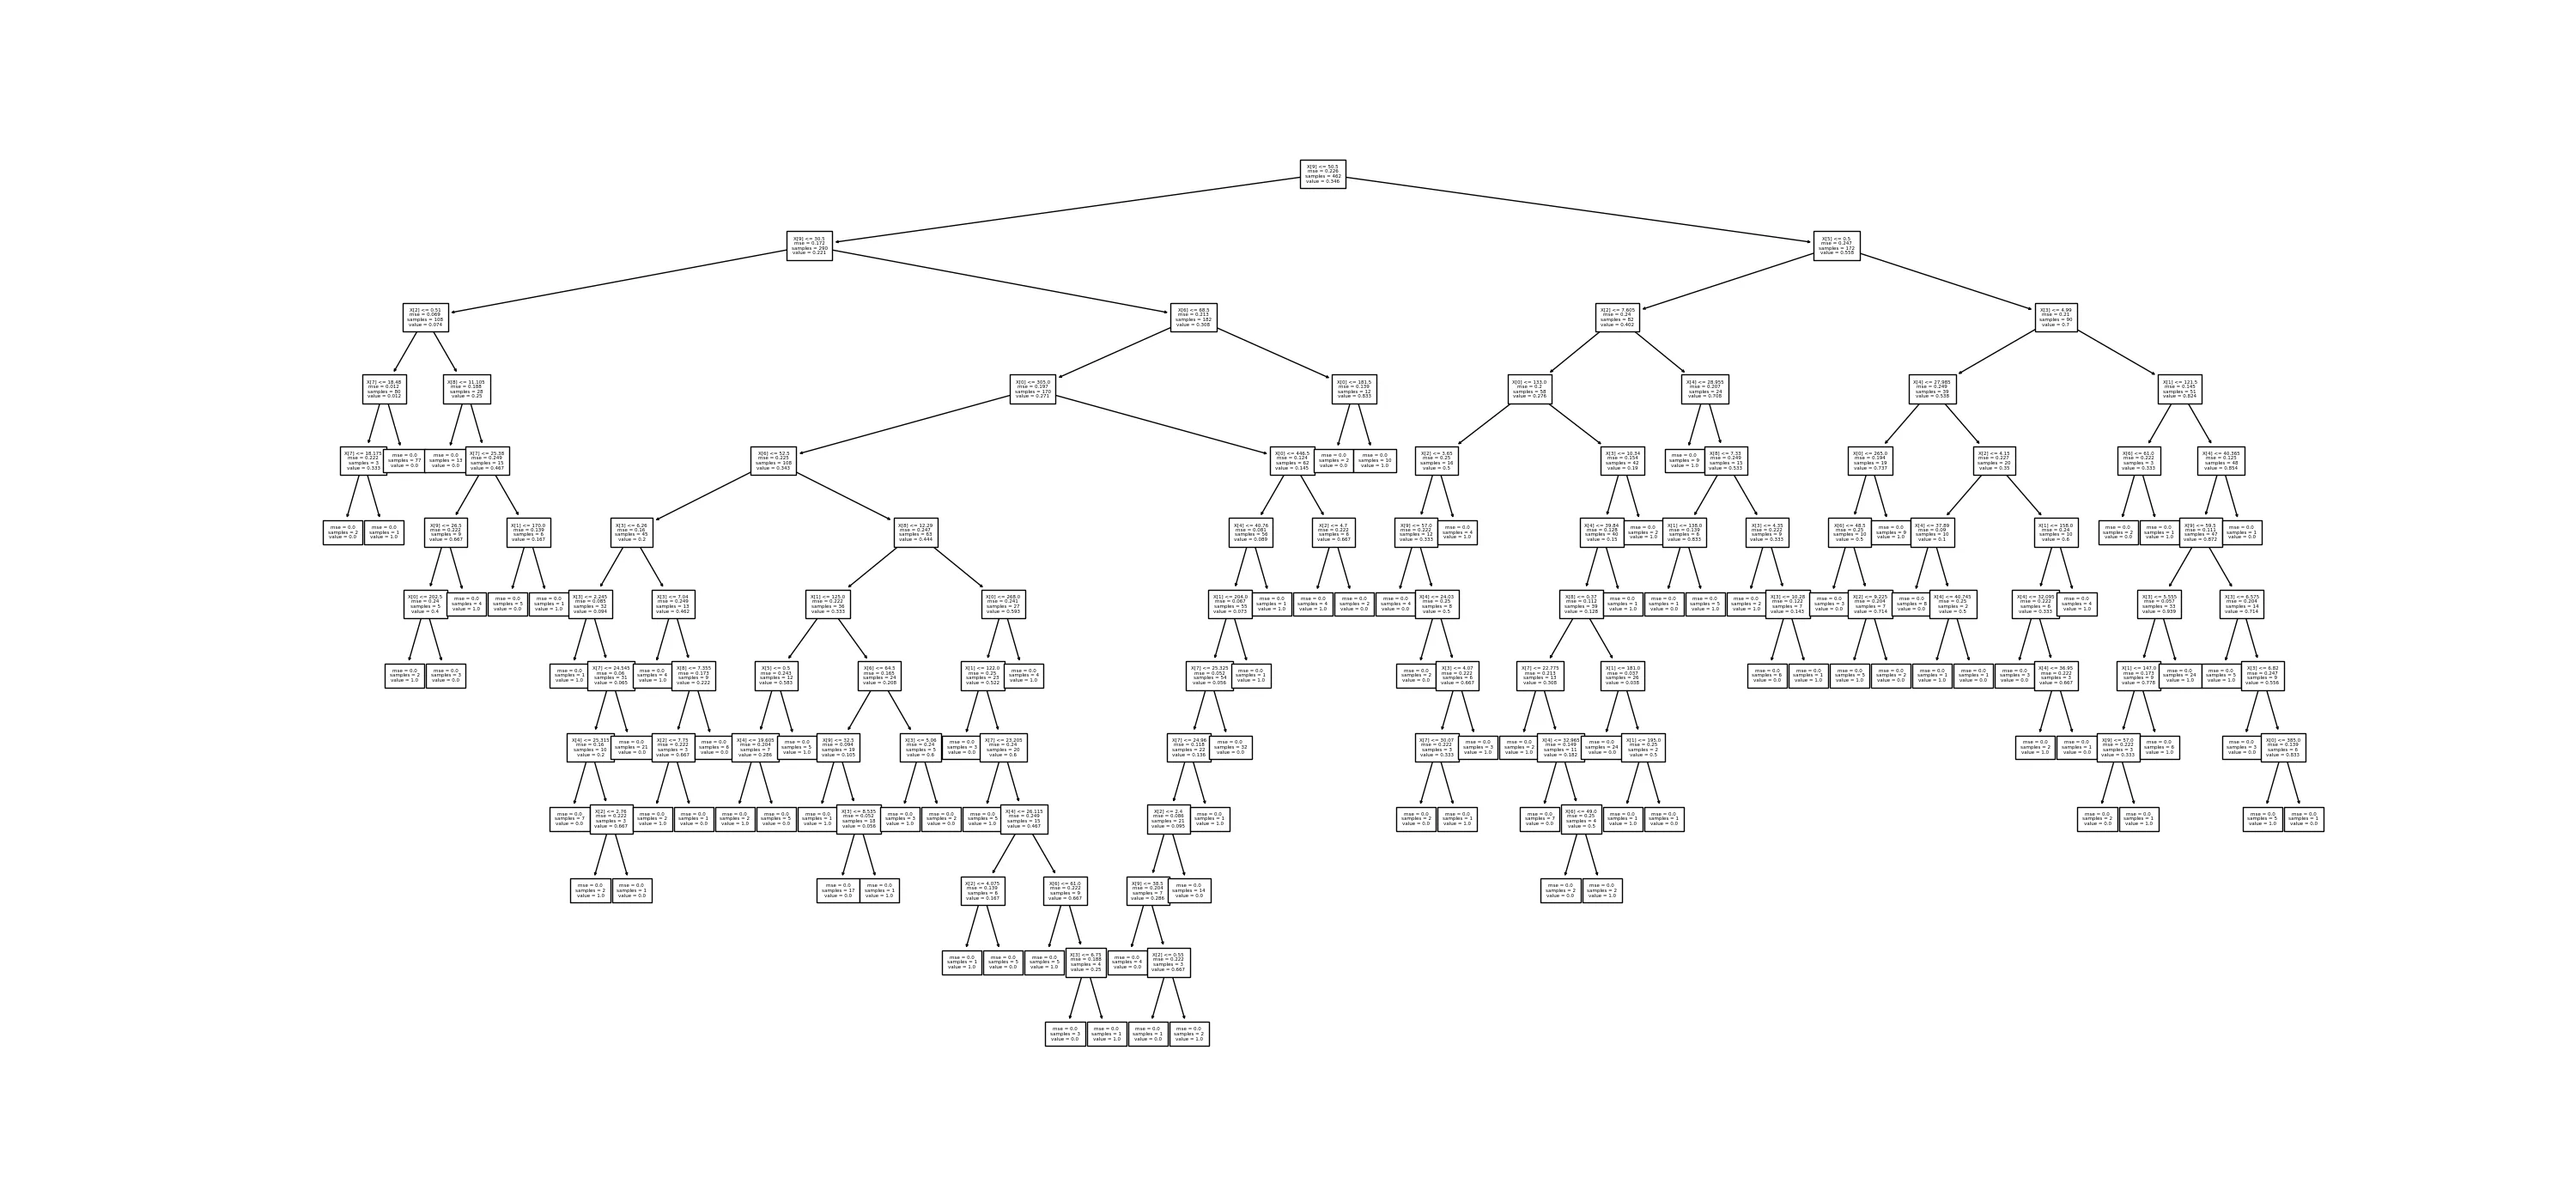
如果您想捕获整个树的结构,我猜保存小字体和高dpi的绘图是解决方案。然后,您可以打开图片并缩放到特定节点以进行检查。
# create and train model
clf = tree.DecisionTreeClassifier()
clf.fit(X, y)

# save plot
plt.figure(figsize=(12,12))
tree.plot_tree(clf, fontsize=6)
plt.savefig('tree_high_dpi', dpi=100)
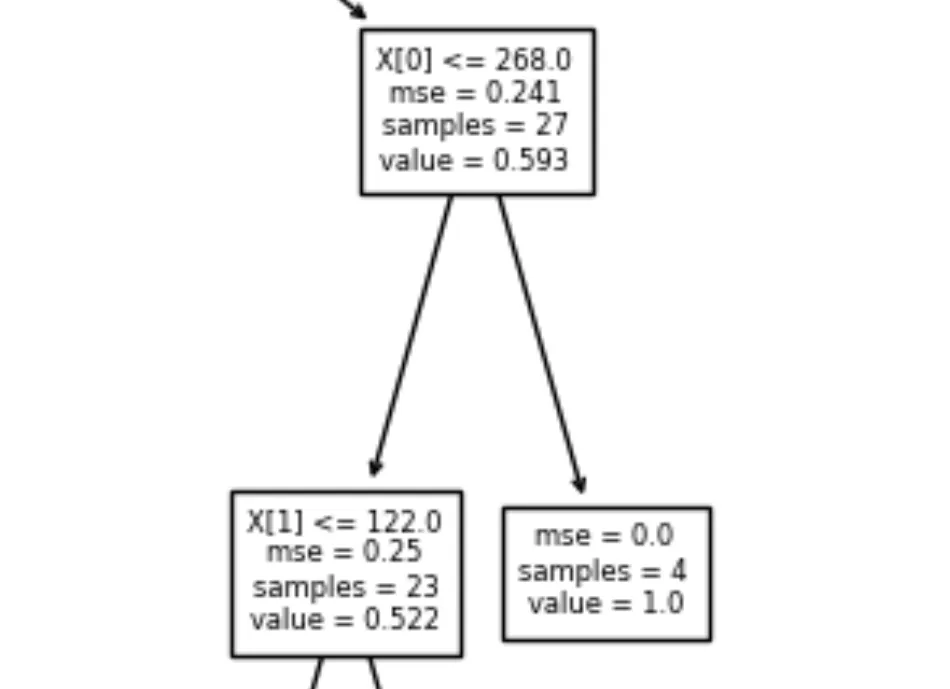
这是在更大的树上看起来的例子。
那么,提前设置图片的尺寸怎么样:
clf = tree.DecisionTreeClassifier()
clf = clf.fit(X, y)

fig, ax = plt.subplots(figsize=(10, 10))  # whatever size you want
tree.plot_tree(clf.fit(X, y), ax=ax)
plt.show()
试试这个:
plt.figure(figsize=(12,12))
tree.plot_tree(clf, fontsize=10)
plt.show()
from sklearn.tree import plot_tree, export_text
fig = plt.figure(figsize=(25,20))
_ = plot_tree(clf)
plot_tree上设置max_depth,例如tree.plot_tree(decision_tree=clf, max_depth=4),而不是在分类器上设置,我认为这是更好的选择,因为在分类器上设置会影响你的决策树的结果,而不仅仅是可视化。 - undefined