我正在尝试配置Prometheus和Grafana与我的Hyperledger Fabric v1.4网络,以分析同行和链代码的度量。按照此文档,我将对等方容器的端口9443映射到主机的端口9443。在对等端的core.yml文件的metrics部分下,我还将provider条目更改为prometheus。我已经按以下方式在docker-compose.yml中配置了Prometheus和Grafana。
  prometheus:
    image: prom/prometheus:v2.6.1
    container_name: prometheus
    volumes:
    - ./prometheus/:/etc/prometheus/
    - prometheus_data:/prometheus
    command:
    - '--config.file=/etc/prometheus/prometheus.yml'
    - '--storage.tsdb.path=/prometheus'
    - '--web.console.libraries=/etc/prometheus/console_libraries'
    - '--web.console.templates=/etc/prometheus/consoles'
    - '--storage.tsdb.retention=200h'
    - '--web.enable-lifecycle'
    restart: unless-stopped
    ports:
    - 9090:9090
    networks:
    - basic
    labels:
    org.label-schema.group: "monitoring"

  grafana:
    image: grafana/grafana:5.4.3
    container_name: grafana
    volumes:
    - grafana_data:/var/lib/grafana
    - ./grafana/datasources:/etc/grafana/datasources
    - ./grafana/dashboards:/etc/grafana/dashboards
    - ./grafana/setup.sh:/setup.sh
    entrypoint: /setup.sh
    environment:
    - GF_SECURITY_ADMIN_USER={ADMIN_USER}
    - GF_SECURITY_ADMIN_PASSWORD={ADMIN_PASS}
    - GF_USERS_ALLOW_SIGN_UP=false
    restart: unless-stopped
    ports:
    - 3000:3000
    networks:
    - basic
    labels:
    org.label-schema.group: "monitoring"
当我在远程CentOS机器上运行curl 0.0.0.0:9443/metrics时,我可以获得所有指标列表。但是,当我使用上述配置运行Prometheus时,它会抛出错误Get http://localhost:9443/metrics: dial tcp 127.0.0.1:9443: connect: connection refused。以下是我的prometheus.yml文件。
global:
  scrape_interval:     15s
  evaluation_interval: 15s

scrape_configs:
  - job_name: 'prometheus'
    scrape_interval: 10s
    static_configs:
      - targets: ['localhost:9090']

  - job_name: 'peer_metrics'
    scrape_interval: 10s
    static_configs:
      - targets: ['localhost:9443']
http://localhost:9443/metrics,也可以获取所有指标。我做错了什么?为什么Prometheus指标显示在其界面上,而不是对等方的界面上?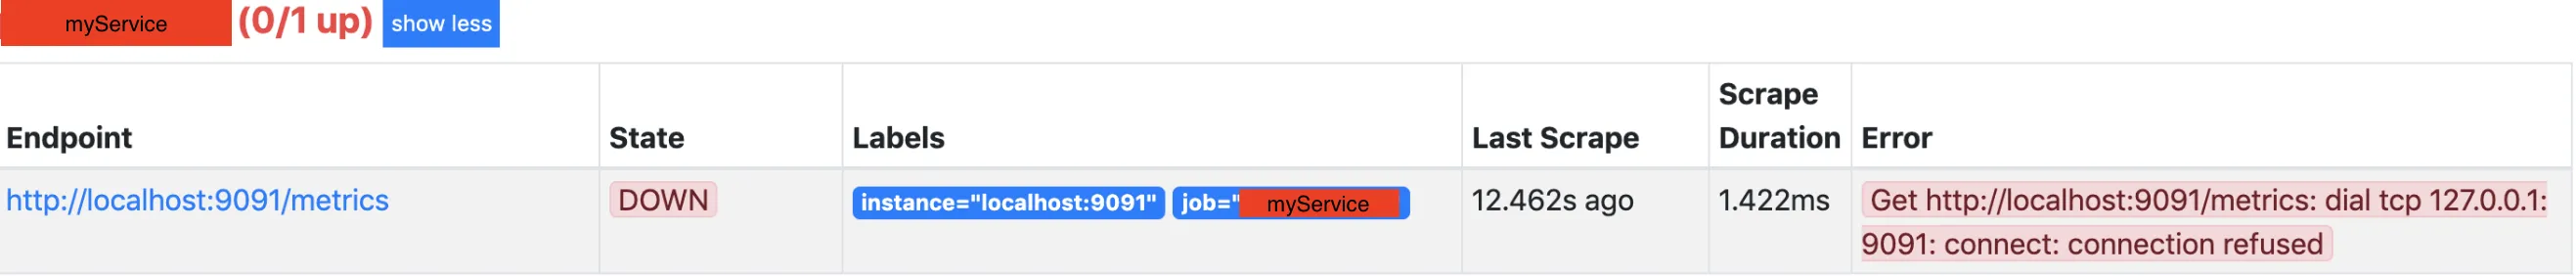
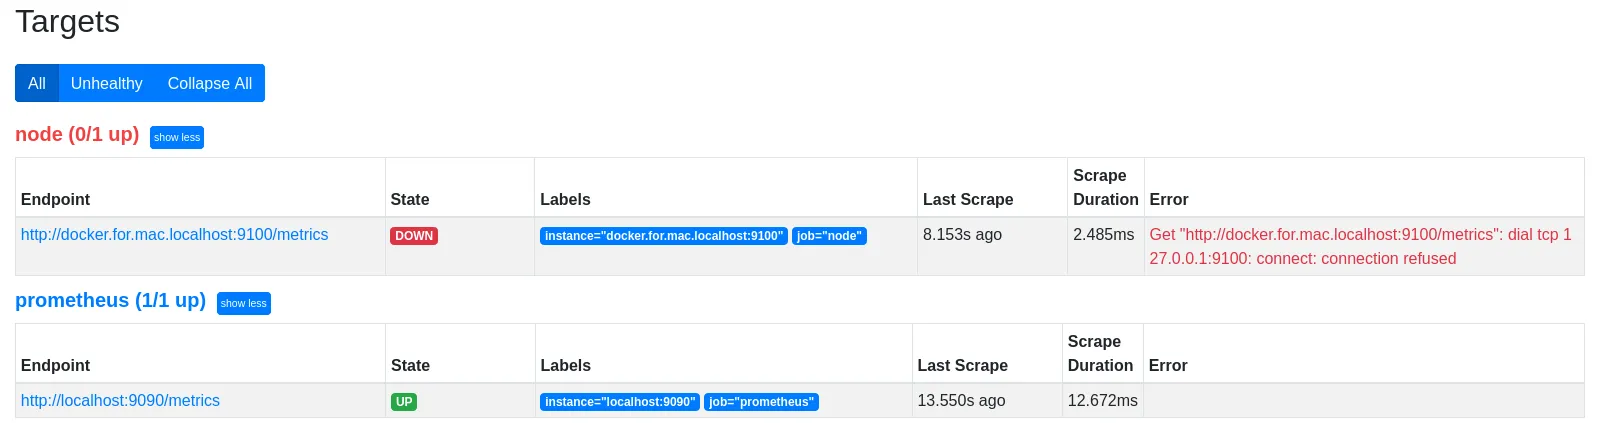
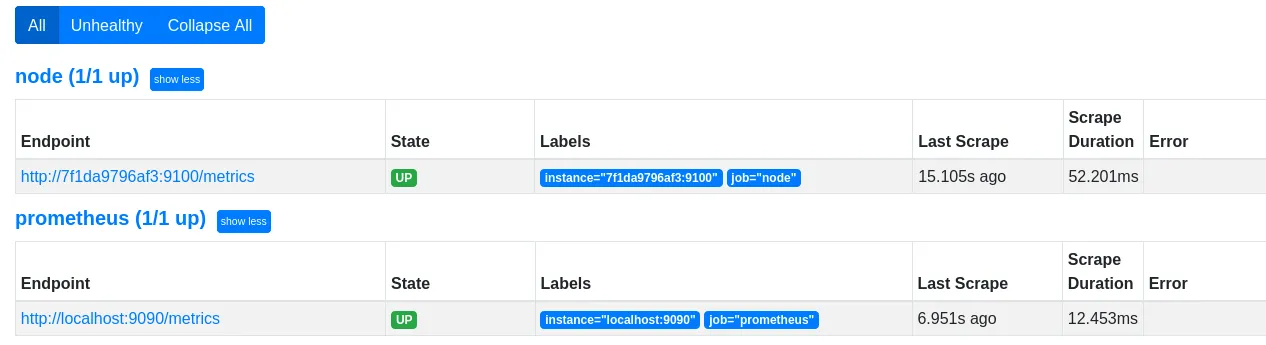
host.docker.internal。docker.for.mac.localhost和docker.for.win.localhost已被弃用。 - Datz