R中使用coord_flip后顺序颠倒了

36

来自dbv的数据示例:

  gender Sektion
1      m       5
2      m       5
3      w      3B
4      w      3B
5      w      3B
6      m       4

我有以下的绘图:

Sekplot <- ggplot(dbv,aes(x=Sektion,
                          fill=factor(gender),
                          stat="bin", 
                          label = paste(round((..count..)/sum(..count..)*100), "%"))) 
Sekplot <- Sekplot + geom_bar(position="fill")
Sekplot <- Sekplot + scale_y_continuous(labels = percent)
Sekplot <- Sekplot + labs(title = "test")
Sekplot <- Sekplot + scale_fill_discrete(name="test", breaks=c("m", "w", "k.A."), labels=c("m", "w", "k.A."))
Sekplot <- Sekplot + geom_hline(aes(yintercept = ges, linetype = "test"), colour = "black", size = 0.75, show_guide = T)
Sekplot <- last_plot() + coord_flip()
Sekplot <- Sekplot + guides(colour = guide_legend(override.aes = list(linetype = 0 )), 
                                    fill = guide_legend(override.aes = list(linetype = 0 )), 
                                    shape = guide_legend(override.aes = list(linetype = 0 )), 
                                    linetype = guide_legend()) + theme(legend.title=element_blank())

Sekplot 

输出:y轴顺序错误的图表

y轴顺序错误的图表

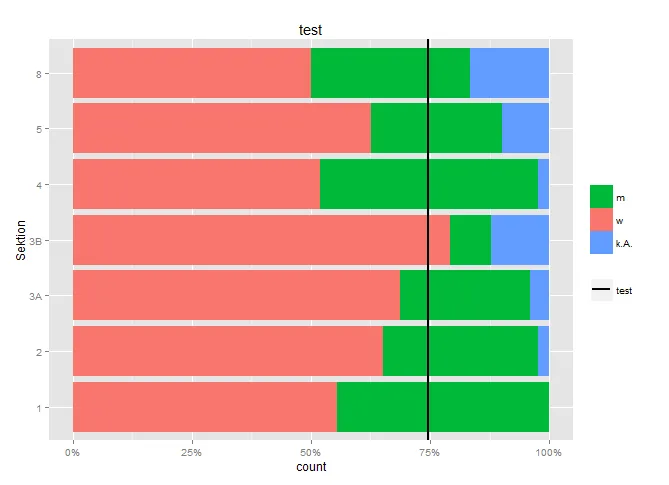
如何反转“Sektion”轴的顺序?我想把1放在上面,8放在下面。

我尝试了以下代码:groupA$Date <- factor(groupA$Date, levels=rev(unique(groupA$Date)))

Sekplot <- last_plot() + coord_flip() + scale_x_reverse()

有多种选择,但找不到正确的方法。


1
你需要类似这样的代码 scale_x_discrete(limits = rev(levels(dat$Sektion))) - 参见此答案 - aosmith
非常感谢,它像魔法一样奏效了!我无法将此问题标记为已解决,因为答案在评论中。 - CH_
2
我没有将它作为答案,因为我正在尝试查找重复项。虽然我还没有找到一个真正好的匹配,但我会将其添加为答案。 - aosmith
2个回答

61

您可以使用limits参数添加scale_x_discrete来完成此操作。您可以按所需的顺序简单地列出限制,但是当您有许多因子级别时,这会变得复杂。

相反,您可以从数据集中提取因子的级别,并利用rev将它们倒序排列。

代码如下:

scale_x_discrete(limits = rev(levels(dbv$Sektion)))

2022年由@slhck编辑

增加了一个示例,使用forcats::fct_rev()函数将因子的级别设置为相反顺序。您可以在数据集中进行更改,也可以直接在映射您的x变量时使用以下方法。

ggplot(dbv, aes(x = forcats::fct_rev(Sektion),
               fill = factor(gender),
               stat = "bin", 
               label = paste(round((..count..)/sum(..count..)*100), "%")
   )
)
...

19
forcats::fct_rev()在这里很有用。 - s_baldur

4

根据@sindri_baldur的建议,在指定美学时,添加fct_rev()如下所示:ggplot(dbv,aes(x=fct_rev(Sektion), fill=factor(gender),stat="bin", label = paste(round((..count..)/sum(..count..)*100), "%")))

这应该就是你需要的全部...从你的代码中删除scale_x_discrete()


网页内容由stack overflow 提供, 点击上面的
可以查看英文原文,
原文链接