沿着离散线段路径均匀分布点

3

我正在尝试编写一个程序,它可以接收一个指示路径的点列表和一个所需标记数,然后应将这些标记沿路径完全均匀地分布。由于路径是循环的,但给定任意起点和终点,我不认为它会影响算法。

第一步是将线段长度相加以确定路径的总长度,然后将其除以标记数以获得标记之间的期望距离。足够简单。

下一步是沿着路径行走,每次穿过另一个标记距离的偶数倍时存储每个标记的坐标。

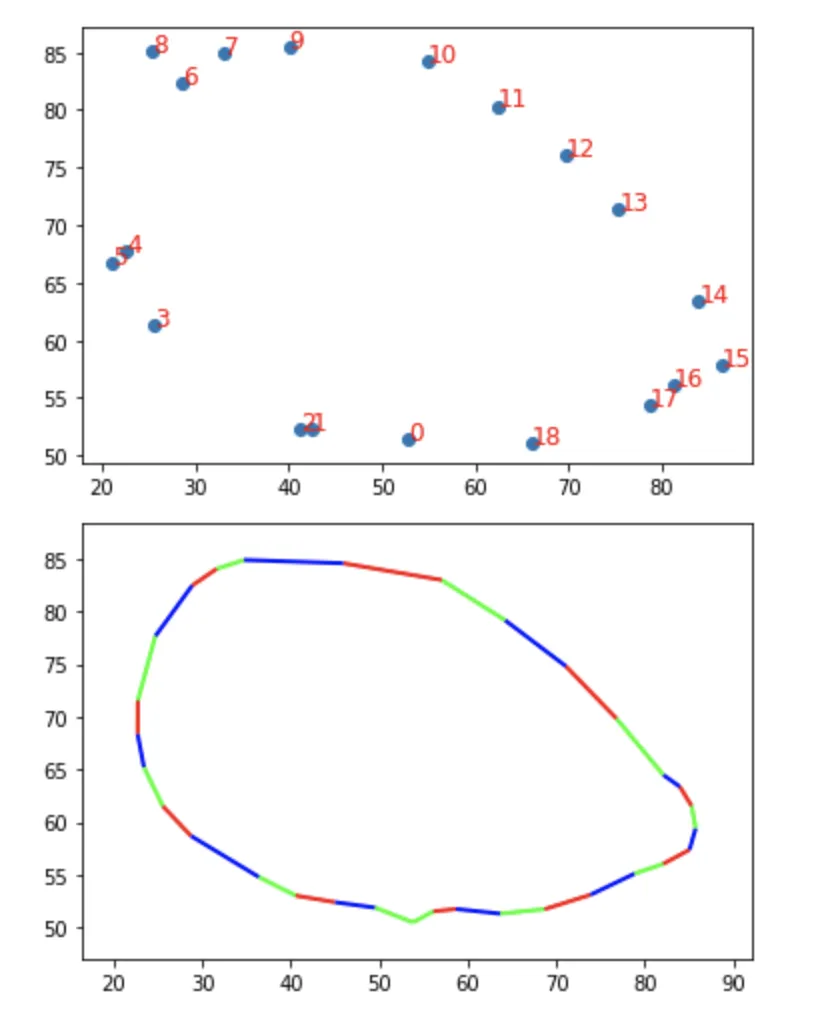
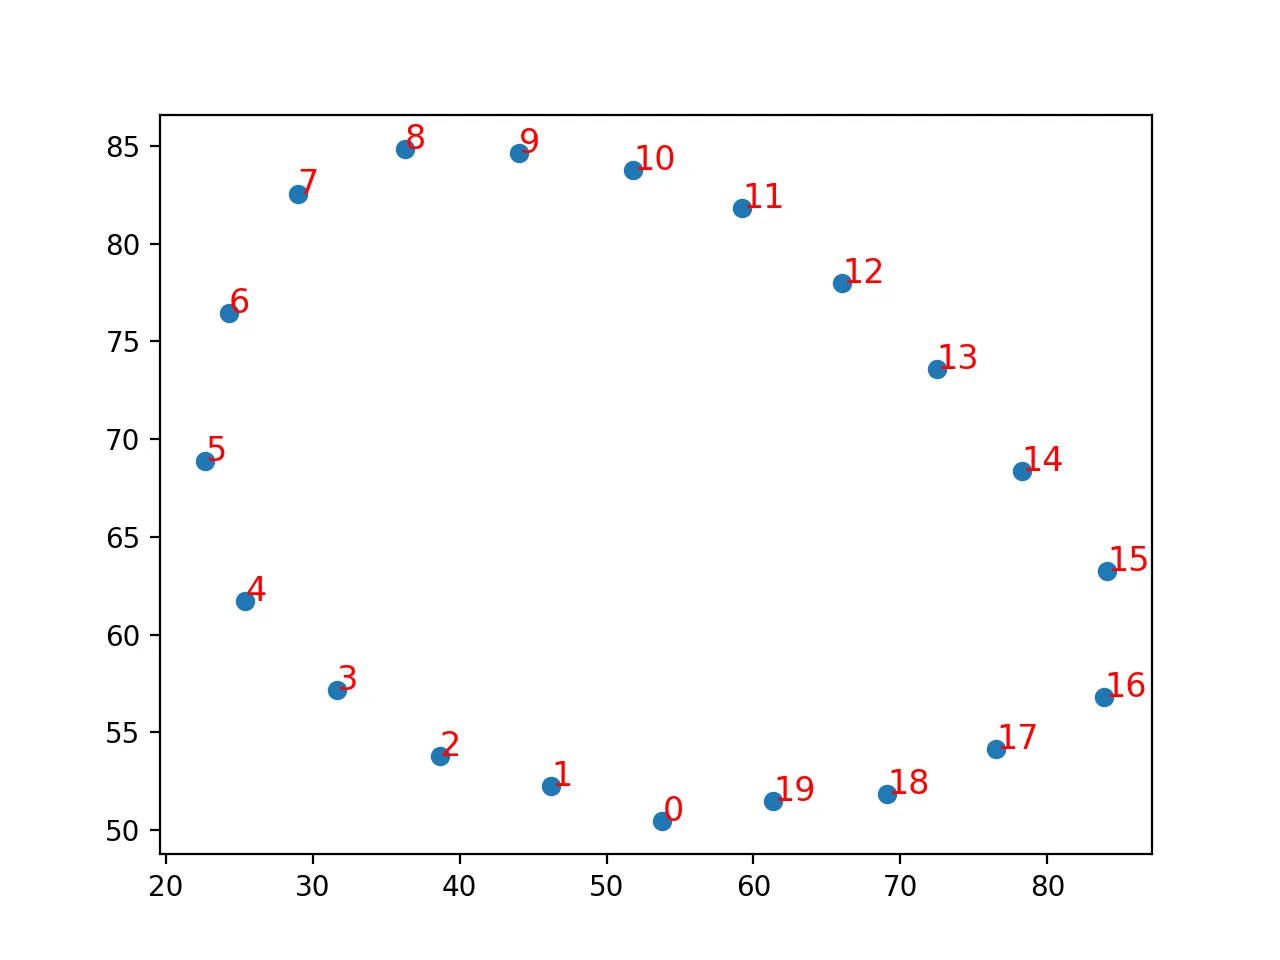
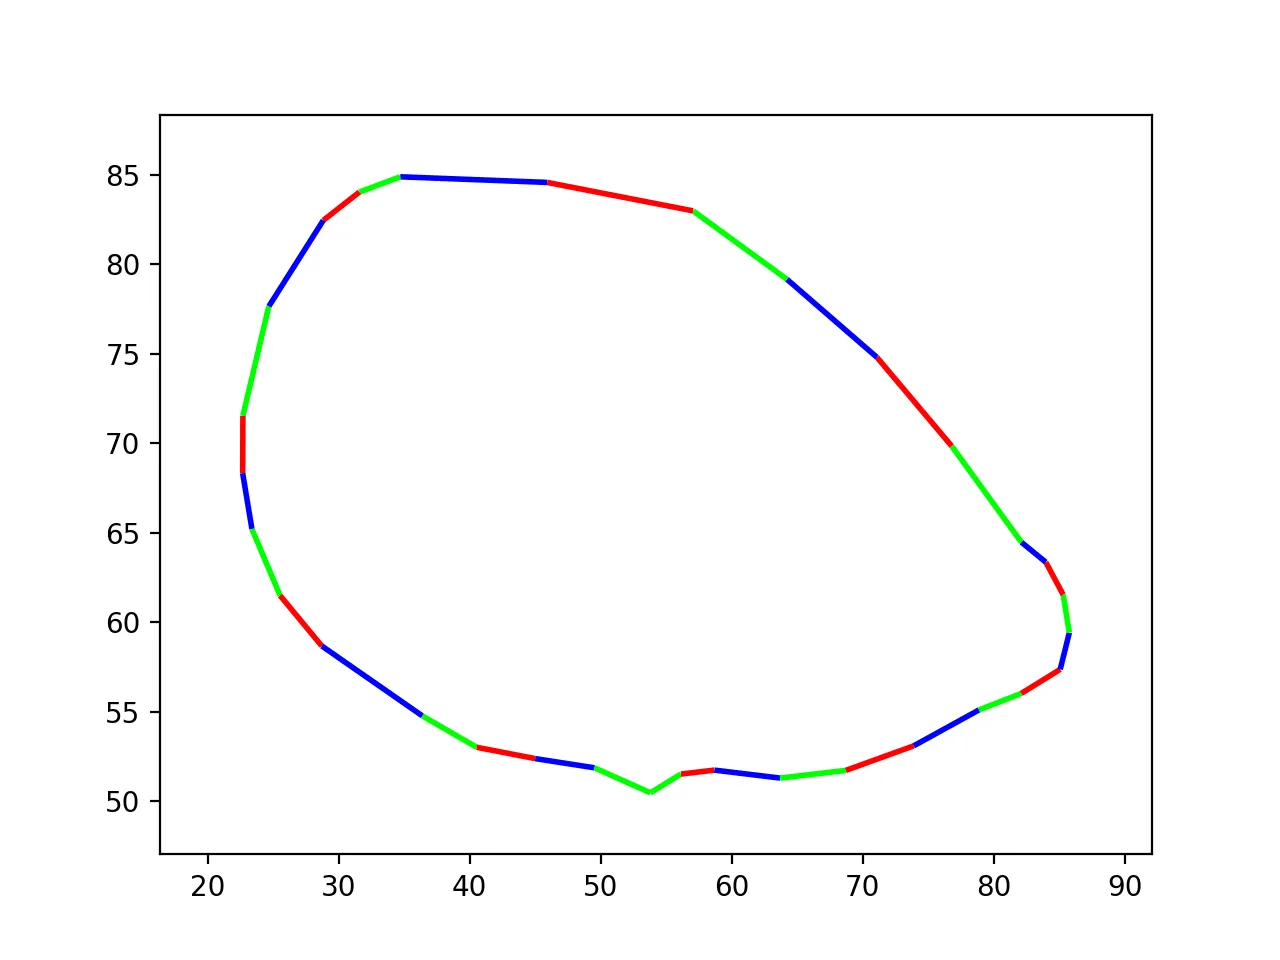
在我的代码中,遍历似乎是正确的,但标记的分布不均匀,也没有完全遵循路径。 我已经在matplotlib中创建了一个可视化,显示标记落在哪里(请参见最后一部分)。

路径数据

point_data = [
 (53.8024, 50.4762), (49.5272, 51.8727), (45.0118, 52.3863), (40.5399, 53.0184), (36.3951, 54.7708),
 (28.7127, 58.6807), (25.5306, 61.4955), (23.3828, 65.2082), (22.6764, 68.3316), (22.6945, 71.535),
 (24.6674, 77.6427), (28.8279, 82.4529), (31.5805, 84.0346), (34.7024, 84.8875), (45.9183, 84.5739),
 (57.0529, 82.9846), (64.2141, 79.1657), (71.089, 74.802), (76.7944, 69.8429), (82.1092, 64.4783),
 (83.974, 63.3605), (85.2997, 61.5455), (85.7719, 59.4206), (85.0764, 57.3729), (82.0979, 56.0247),
 (78.878, 55.1062), (73.891, 53.0987), (68.7101, 51.7283), (63.6943, 51.2997), (58.6791, 51.7438),
 (56.1255, 51.5243), (53.8024, 50.4762), (53.8024, 50.4762)]

遍历

import math

number_of_points = 20

def euclid_dist(x1, y1, x2, y2):
  return ((x1-x2)**2 + (y1-y2)**2)**0.5

def move_point(x0, y0, d, theta_rad):
  return x0 + d*math.cos(theta_rad), y0 + d*math.sin(theta_rad)

total_dist = 0
for i in range(1, len(point_data), 1):
  x1, y1 = point_data[i - 1]
  x2, y2 = point_data[i]
  total_dist += euclid_dist(x1, y1, x2, y2)

dist_per_point = total_dist / number_of_points

length_left_over = 0  # distance left over from the last segment
# led_id = 0

results = []

for i in range(1, len(point_data), 1):
  x1, y1 = point_data[i - 1]
  x2, y2 = point_data[i]

  angle_rads  = math.atan2(y1-y2, x1-x2)
  extra_rotation = math.pi / 2  # 90deg
  angle_output = math.degrees((angle_rads + extra_rotation + math.pi) % (2*math.pi) - math.pi)
  length_of_segment = euclid_dist(x1, y1, x2, y2)
    
  distance_to_work_with = length_left_over + length_of_segment
  
  current_dist = dist_per_point - length_left_over

  while distance_to_work_with > dist_per_point:

    new_point = move_point(x1, y1, current_dist, angle_rads)
    results.append((new_point[0], new_point[1], angle_output))

    current_dist += dist_per_point
    
    distance_to_work_with -= dist_per_point

  length_left_over = distance_to_work_with

可视化代码

import matplotlib.pyplot as plt
from matplotlib import collections  as mc
import numpy as np

X = np.array([x for x, _, _ in results])
Y = np.array([y for _, y, _ in results])

plt.scatter(X, Y)

for i, (x, y) in enumerate(zip(X, Y)):
    plt.text(x, y, str(i), color="red", fontsize=12)

possible_colors = [(1, 0, 0, 1), (0, 1, 0, 1), (0, 0, 1, 1)]

lines = []
colors = []
for i in range(len(point_data) -1 , 0, -1):
  x1, y1 = point_data[i - 1]
  x2, y2 = point_data[i]
  lines.append(((x1, y1), (x2, y2)))
  colors.append(possible_colors[i % 3])

lc = mc.LineCollection(lines, colors = colors, linewidths=2)
fig, ax = plt.subplots()
ax.add_collection(lc)
ax.autoscale()
ax.margins(0.1)

plt.show()

可视化结果

输入图像说明


2
第一印象是,在计算中根本不需要使用角度,错误来自于将前一个线段的剩余距离应用于新线段,但使用新角度而不是前一个角度。您可以通过在每个线段方向上创建单位法向量并将其乘以要移动的长度来简化代码,并摆脱所有角度相关的内容。 - samgak
什么是单位法向量? - the five states
1
为计算单位向量,需计算x和y的差异,并除以距离。例如,给定点point1 = (x1, y1)point2 = (x2, y2)相距5.0个单位,单位向量为((x2-x1) / 5.0, (y2-y1) / 5.0)。结果是一个指向从point1到point2方向的向量,并具有单位长度。从point1开始,向point2移动4.1个单位时,新点为x = x1 + 4.1 * (x2-x1)/5.0y = y1 + 4.1 * (x2-x1)/5.0。也称为线性插值,这允许沿路径移动而无需三角函数。 - user3386109
1个回答

1
关键在于找到路径上每个要分布的点所在的路段,基于从路径起点开始跨越所有路段的累积距离。然后,根据点在路径上所在的路段的两端点之间的距离进行插值。下面的代码使用了numpy数组处理和列表推导来实现这一过程:
    point_data = [
        (53.8024, 50.4762), (49.5272, 51.8727), (45.0118, 52.3863), (40.5399, 53.0184), (36.3951, 54.7708),
        (28.7127, 58.6807), (25.5306, 61.4955), (23.3828, 65.2082), (22.6764, 68.3316), (22.6945, 71.535),
        (24.6674, 77.6427), (28.8279, 82.4529), (31.5805, 84.0346), (34.7024, 84.8875), (45.9183, 84.5739),
        (57.0529, 82.9846), (64.2141, 79.1657), (71.089, 74.802), (76.7944, 69.8429), (82.1092, 64.4783),
        (83.974, 63.3605), (85.2997, 61.5455), (85.7719, 59.4206), (85.0764, 57.3729), (82.0979, 56.0247),
        (78.878, 55.1062), (73.891, 53.0987), (68.7101, 51.7283), (63.6943, 51.2997), (58.6791, 51.7438),
        (56.1255, 51.5243), (53.8024, 50.4762), (53.8024, 50.4762)
    ]

    number_of_points = 20

    def euclid_dist(x1, y1, x2, y2):
        return ((x1-x2)**2 + (y1-y2)**2)**0.5

    # compute distances between segment end-points (padded with 0. at the start)
    # I am using the OP supplied function and list comprehension, but this
    # can also be done using numpy
    dist_between_points = [0.] + [euclid_dist(p0[0], p0[1], p1[0], p1[1])
                                  for p0, p1 in zip(point_data[:-1], point_data[1:])]
    cum_dist_to_point = np.cumsum(dist_between_points)
    total_dist = sum(dist_between_points)

    cum_dist_per_point = np.linspace(0., total_dist, number_of_points, endpoint=False)
    # find the segment that the points will be in
    point_line_segment_indices = np.searchsorted(cum_dist_to_point, cum_dist_per_point, side='right').astype(int)
    # then do linear interpolation for the point based on distance between the two end points of the segment
    #   d0s: left end-point cumulative distances from start for segment containing point
    #   d1s: right end-point cumulative distances from start for segment containing point
    #   alphas: the interpolation distance in the segment
    #   p0s: left end-point for segment containing point
    #   p1s: right end-point for segment containing point    
    d0s = cum_dist_to_point[point_line_segment_indices - 1]
    d1s = cum_dist_to_point[point_line_segment_indices]
    alphas = (cum_dist_per_point - d0s) / (d1s - d0s)
    p0s = [point_data[segment_index - 1] for segment_index in point_line_segment_indices]
    p1s = [point_data[segment_index] for segment_index in point_line_segment_indices]
    results = [(p0[0] + alpha * (p1[0] - p0[0]), p0[1] + alpha * (p1[1] - p0[1]))
               for p0, p1, alpha in zip(p0s, p1s, alphas)]

数组 cum_dist_to_point 是从起点到 point_data 中每个点的路径累计(跨越段)距离,数组 cum_dist_per_point 是沿路径为我们要均匀分布的点数累积距离。请注意,我们使用 np.searchsorted 来确定位于给定距离的点所在路径上的路径段(由起点累计距离)。根据文档,searchsorted 的说明为:

找到索引进入已排序数组(第一个参数),使得如果将第二个参数中对应的元素插入到这些索引之前,则顺序会被保留。

然后,使用 OP 的绘图函数(稍作修改,因为 results 不再具有角度组件):
def plot_me(results):
    X = np.array([x for x, _ in results])
    Y = np.array([y for _, y in results])

    plt.scatter(X, Y)

    for i, (x, y) in enumerate(zip(X, Y)):
        plt.text(x, y, str(i), color="red", fontsize=12)

    possible_colors = [(1, 0, 0, 1), (0, 1, 0, 1), (0, 0, 1, 1)]

    lines = []
    colors = []
    for i in range(len(point_data) -1, 0, -1):
        x1, y1 = point_data[i - 1]
        x2, y2 = point_data[i]
        lines.append(((x1, y1), (x2, y2)))
        colors.append(possible_colors[i % 3])

    lc = mc.LineCollection(lines, colors=colors, linewidths=2)
    fig, ax = plt.subplots()
    ax.add_collection(lc)
    ax.autoscale()
    ax.margins(0.1)

    plt.show()

我们有:

    plot_me(results)

enter image description here

enter image description here


网页内容由stack overflow 提供, 点击上面的
可以查看英文原文,
原文链接