使用PySimpleGUI窗口实现Matplotlib图表自动更新

3

我正在创建一个GUI,允许用户查看分光仪的“实时视图”,其中数据从分光仪中获取并在Matplotlib中绘制以显示在GUI窗口中。 GUI还有一些其他按钮,允许用户通过其他功能(不相关但只是背景)。

我使用while循环和清除数据重新绘制,在Matplotlib中已使实时视图工作:

while True:
    data = ccs.take_data(num_avg=3) # spectrometer function
    norm = (data[0]-dark[0])/(light[0]-dark[0]) # some calcs.
    plt.plot(data[1],norm)
    plt.axis([400,740,0,1.1])  
    plt.grid(color='w', linestyle='--')       
    plt.xlabel('Wavelength [nm]')
    plt.ylabel('Normalized Intesity')          
    plt.pause(0.1)
    plt.cla()

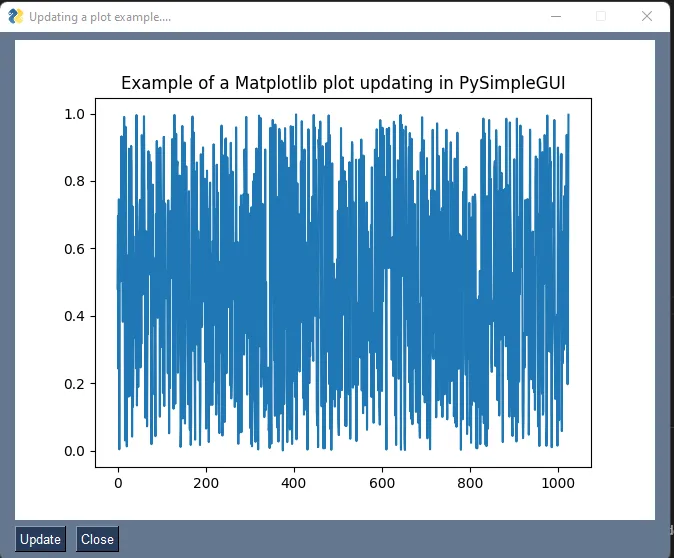
下一步是在PySimpleGUI中展示这张图表。比预想的难...我能够使用一些来自PySimpleGUI的演示代码,让单个图表出现并且如果用户按下“更新”按钮也能够更新:
from instrumental.drivers.spectrometers import thorlabs_ccs
from matplotlib.backends.backend_tkagg import FigureCanvasTkAgg
import PySimpleGUI as sg
import matplotlib, time, threading
matplotlib.use('TkAgg')
import matplotlib.pyplot as plt


def fig_maker(ccs, dark, sub):
    plt.clf()
    plt.close()
    data = ccs.take_data(num_avg=3)
    norm = (data[0]-dark[0])/(sub[0]-dark[0])
    plt.plot(data[1],norm,c='r')
    plt.axis([400,750,0,1.1])  
    plt.grid(color='w', linestyle='--')       
    plt.xlabel('Wavelength [nm]')
    plt.ylabel('Normalized Intesity')  

return plt.gcf() 


def draw_figure(canvas, figure, loc=(0, 0)):
    figure_canvas_agg = FigureCanvasTkAgg(figure, canvas)
    figure_canvas_agg.draw()
    figure_canvas_agg.get_tk_widget().pack(side='top', fill='both', expand=1)
    return figure_canvas_agg


def delete_fig_agg(fig_agg):
    fig_agg.get_tk_widget().forget()
    plt.close('all')


if __name__ == '__main__':
    
    ... some code ...

    # define the window layout
    layout = [[sg.Button('update')],
              [sg.Text('Plot test', font='Any 18')],             
              [sg.Canvas(size=(500,500), key='canvas')] ]

    # create the form and show it without the plot
    window = sg.Window('Demo Application - Embedding Matplotlib In PySimpleGUI',
                       layout, finalize=True)

    fig_agg = None
    while True:
        event, values = window.read()
        if event is None:  # if user closes window
            break         
        if event == "update":
            if fig_agg is not None:
                delete_fig_agg(fig_agg)
            fig = fig_maker(ccs,dark,sub)
            fig_agg = draw_figure(window['canvas'].TKCanvas, fig) 
    window.close()            

现在是有趣的部分(我似乎无法让它工作)。我希望绘图始终更新,类似于我只使用matplotlib时所做的那样,以便用户不必按“更新”按钮。使用PySimpleGUI长时间任务多线程示例是我的程序开始失败的地方。实际上,除了向Debug I/O打印***模拟超时***之外,我没有收到任何错误提示,然后Python关闭脚本。

我甚至尝试做一个10次迭代的for循环而不是连续的while循环:

from instrumental.drivers.spectrometers import thorlabs_ccs
from matplotlib.backends.backend_tkagg import FigureCanvasTkAgg
import PySimpleGUI as sg
import matplotlib, time, threading
matplotlib.use('TkAgg')
import matplotlib.pyplot as plt


def long_function_thread(window, ccs, dark, sub):
    for i in range(10):
        fig = fig_maker(ccs, dark, sub)
        fig_agg = draw_figure(window['canvas'].TKCanvas, fig) 
        window.write_event_value('-THREAD PROGRESS-', i)
        time.sleep(1)
        delete_fig_agg(fig_agg)
        time.sleep(0.1)

    window.write_event_value('-THREAD DONE-', '')


def long_function(window, ccs, dark, sub):
    print('In long_function')
    threading.Thread(target=long_function_thread, args=(window, ccs, dark, sub), daemon=True).start()


def fig_maker(ccs, dark, sub):
    plt.clf()
    plt.close()
    data = ccs.take_data(num_avg=3)
    norm = (data[0]-dark[0])/(sub[0]-dark[0])
    plt.plot(data[1],norm,c='r')
    plt.axis([400,750,0,1.1])  
    plt.grid(color='w', linestyle='--')       
    plt.xlabel('Wavelength [nm]')
    plt.ylabel('Normalized Intesity')  
    
    return plt.gcf() 


def draw_figure(canvas, figure, loc=(0, 0)):
    figure_canvas_agg = FigureCanvasTkAgg(figure, canvas)
    figure_canvas_agg.draw()
    figure_canvas_agg.get_tk_widget().pack(side='top', fill='both', expand=1)
    return figure_canvas_agg


def delete_fig_agg(fig_agg):
    fig_agg.get_tk_widget().forget()
    plt.close('all')


if __name__ == '__main__':
    
     ... some code ...

    # define the window layout
    layout = [[sg.Button('Go')],
              [sg.Text('Plot test', font='Any 18')],            
              [sg.Canvas(size=(500,500), key='canvas')] ]

    # create the form and show it without the plot
    window = sg.Window('Demo Application - Embedding Matplotlib In PySimpleGUI',
                       layout, finalize=True)

    fig_agg = None
    while True:
        event, values = window.read()
        if event is None or event == 'Exit':
            break
        if event == 'Go':
            print('Calling plotter')
            long_function(window, ccs, dark, sub)
            print('Long function has returned from starting')            
        elif event == '-THREAD DONE-':
            print('Your long operation completed')

window.close()

很抱歉这里有些冗长的描述和代码堆积,但我认为这是最容易解释的方式。如果能够在此问题上提供任何帮助或链接,将不胜感激。

如果有人想要运行我的脚本,则应该只会生成一个随机图表。

def random_fig_maker():
   plt.scatter(np.random.rand(1,10),np.random.rand(1,10))
   return plt.gcf()
2个回答

2

虽然与此不直接相关,但我遇到过类似的问题。这能帮到你吗?

import PySimpleGUI as sg
import matplotlib.pyplot as plt
from matplotlib.backends.backend_tkagg import FigureCanvasTkAgg
import numpy as np

class updateable_matplotlib_plot():
    def __init__(self, canvas) -> None:
        self.fig_agg = None
        self.figure = None
        self.canvas = canvas

    def plot(self, data):
        self.data = data
        self.figure_controller()
        self.figure_drawer()

    #put all of your normal matplotlib stuff in here
    def figure_controller(self):
        #first run....
        if self.figure is None:
            self.figure = plt.figure()
            self.axes = self.figure.add_subplot(111)
            self.line, = self.axes.plot(self.data)
            self.axes.set_title("Example of a Matplotlib plot updating in PySimpleGUI")
        #all other runs
        else:            
            self.line.set_ydata(self.data)#update data            
            self.axes.relim() #scale the y scale
            self.axes.autoscale_view() #scale the y scale

    #finally draw the figure on a canvas
    def figure_drawer(self):
        if self.fig_agg is not None: self.fig_agg.get_tk_widget().forget()
        self.fig_agg = FigureCanvasTkAgg(self.figure, self.canvas.TKCanvas)
        self.fig_agg.get_tk_widget().pack(side='top', fill='both', expand=1)
        self.fig_agg.draw()

def getGUI():
    # All the stuff inside your window.
    layout = [  [sg.Canvas(size=(500,500), key='canvas')],
                [sg.Button('Update', key='update'), sg.Button('Close')] ]

    # Create the Window
    window = sg.Window('Updating a plot example....', layout)
    return window


if __name__ == '__main__':
    window = getGUI()
    spectraPlot = updateable_matplotlib_plot(window['canvas']) #what canvas are you plotting it on
    window.finalize() #show the window
    spectraPlot.plot(np.zeros(1024)) # plot an empty plot    
    while True:
        event, values = window.read()
        if event == "update":
             some_spectrum = np.random.random(1024) # data to be plotted
             spectraPlot.plot(some_spectrum) #plot the data           
        if event == sg.WIN_CLOSED or event == 'Close': break # if user closes window or clicks cancel

    window.close()

enter image description here


2
您需要使用两个额外的PySimpleGUI功能:window.Refresh()window.write_event_value()。当您删除figg_agg并准备好新图时,请调用window.Refresh()。这将重新绘制窗口,但也会引入一个问题:主事件(while)循环将永远运行。为了解决这个问题,您还需要在从事件循环内部调用的某个函数中添加window.write_event_value('-THREAD-', 'some message.')。这将作为外部触发器,使事件循环保持运行,但这也将使窗口响应,因此您可以更改其他窗口元素(这里我使用了单选开关)来停止循环。

如果要获得奖励分数,则还可以将“触发函数”作为单独的线程运行。time.sleep()在该函数中将不会影响GUI的响应性。因此,我会使用一些数据收集函数,只返回一些列表或元组作为重启循环的触发器。在这种情况下,matplotlib对于在外部线程中被调用感到不满意,因此我只是在事件循环中添加了延迟以保持绘图可见。

from matplotlib.backends.backend_tkagg import FigureCanvasTkAgg
import PySimpleGUI as sg
import matplotlib, time, threading
matplotlib.use('TkAgg')
import matplotlib.pyplot as plt
import numpy as np


def fig_maker(window): # this should be called as a thread, then time.sleep() here would not freeze the GUI
    plt.scatter(np.random.rand(1,10),np.random.rand(1,10))
    window.write_event_value('-THREAD-', 'done.')
    time.sleep(1)
    return plt.gcf()


def draw_figure(canvas, figure, loc=(0, 0)):
    figure_canvas_agg = FigureCanvasTkAgg(figure, canvas)
    figure_canvas_agg.draw()
    figure_canvas_agg.get_tk_widget().pack(side='top', fill='both', expand=1)
    return figure_canvas_agg


def delete_fig_agg(fig_agg):
    fig_agg.get_tk_widget().forget()
    plt.close('all')


if __name__ == '__main__':
    # define the window layout
    layout = [[sg.Button('update'), sg.Button('Stop', key="-STOP-"), sg.Button('Exit', key="-EXIT-")],
              [sg.Radio('Keep looping', "RADIO1", default=True, size=(12,3),key="-LOOP-"),sg.Radio('Stop looping', "RADIO1", size=(12,3), key='-NOLOOP-')],
              [sg.Text('Plot test', font='Any 18')],             
              [sg.Canvas(size=(500,500), key='canvas')]]

    # create the form and show it without the plot
    window = sg.Window('Demo Application - Embedding Matplotlib In PySimpleGUI',
                       layout, finalize=True)

    fig_agg = None
    while True:
        event, values = window.read()
        if event is None:  # if user closes window
            break
        
        if event == "update":
            if fig_agg is not None:
                    delete_fig_agg(fig_agg)
            fig = fig_maker(window)
            fig_agg = draw_figure(window['canvas'].TKCanvas, fig)

        if event == "-THREAD-":
            print('Acquisition: ', values[event])
            time.sleep(1)
            if values['-LOOP-'] == True:
                if fig_agg is not None:
                    delete_fig_agg(fig_agg)
                fig = fig_maker(window)
                fig_agg = draw_figure(window['canvas'].TKCanvas, fig)
                window.Refresh()
        
        if event == "-STOP-":
            window['-NOLOOP-'].update(True)
        
        if event == "-EXIT-":
            break
            
    
    window.close()            

网页内容由stack overflow 提供, 点击上面的
可以查看英文原文,
原文链接