如果我想将小刻度线添加到x轴的自定义位置,等同于以下主要刻度命令:plt.xticks([1,2,3])。
我尝试过:
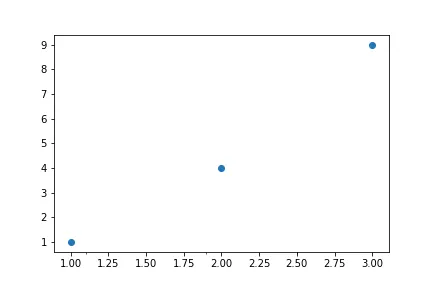
import matplotlib.pyplot as plt
x = [1,2,3]
y = [1,4,9]
plt.scatter(x,y)
ax = plt.gca()
ax.xaxis.set_minor_locator([1.1, 1.9, 2.5])
但是这会引发一个错误,因为最后一个命令可能需要一个ticker对象作为参数,而不是一个列表。有没有一种Pythonic的方法来解决这个问题?