在Shiny中绘图,基于CSV文件的列名创建选择列表。

3
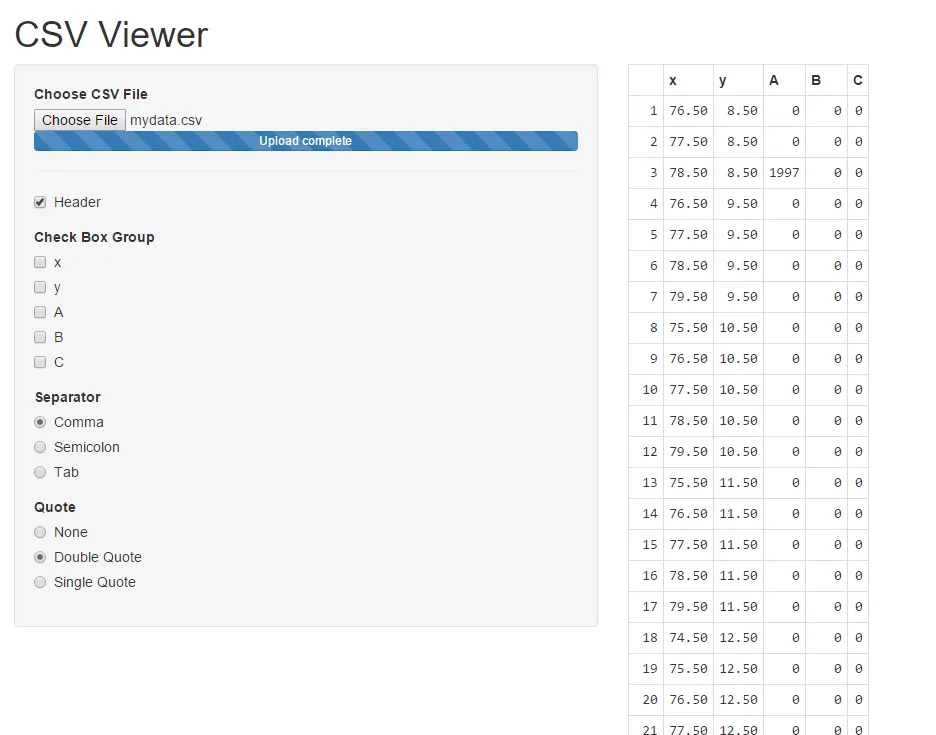
我正在尝试构建一个闪亮的应用程序,可以上传CSV文件,并基于列名称在UI中的左侧(滑杆列)上填充复选框。根据选择的y轴列和x轴列,需要能够使用ggplot创建图表。
我的ui.R如下所示:
shinyUI(pageWithSidebar(
  headerPanel("CSV Viewer"),
  sidebarPanel(
    fileInput('file1', 'Choose CSV File',
              accept=c('text/csv', 'text/comma-separated-values,text/plain', '.csv')),
    tags$hr(),
    checkboxInput('header', 'Header', TRUE),
    radioButtons('sep', 'Separator',
                 c(Comma=',',
                   Semicolon=';',
                   Tab='\t'),
                 'Comma'),
    radioButtons('quote', 'Quote',
                 c(None='',
                   'Double Quote'='"',
                   'Single Quote'="'"),
                 'Double Quote'),

   checkboxGroupInput("variable", "Variable:", choices = names(data_set))
  ),
  mainPanel(
    tableOutput('contents')


  )
))

Server.R看起来像这样:

shinyServer(function(input, output) {
  output$contents <- renderTable({

    # input$file1 will be NULL initially. After the user selects and uploads a 
    # file, it will be a data frame with 'name', 'size', 'type', and 'datapath' 
    # columns. The 'datapath' column will contain the local filenames where the 
    # data can be found.

    inFile <- input$file1

    if (is.null(inFile))
      return(NULL)

    data_set<-read.csv(inFile$datapath, header=input$header, sep=input$sep, quote=input$quote)
  })

  output$choose_dataset <- renderUI({
    selectInput("dataset", "Data set", as.list(data_sets))
  })

  # Check boxes
  output$choose_columns <- renderUI({
    # If missing input, return to avoid error later in function
    if(is.null(input$dataset))
      return()

    # Get the data set with the appropriate name

    colnames <- names(contents)

    # Create the checkboxes and select them all by default
    checkboxGroupInput("columns", "Choose columns", 
                       choices  = colnames,
                       selected = colnames)
  })

})

我无法在滑动条中加载数据集中的列名?有什么指针可以帮助我做到这一点。我正在加载一个csv文件,一旦文件加载完成,我需要能够使用数据集的列名填充滑块。

更新-编辑:

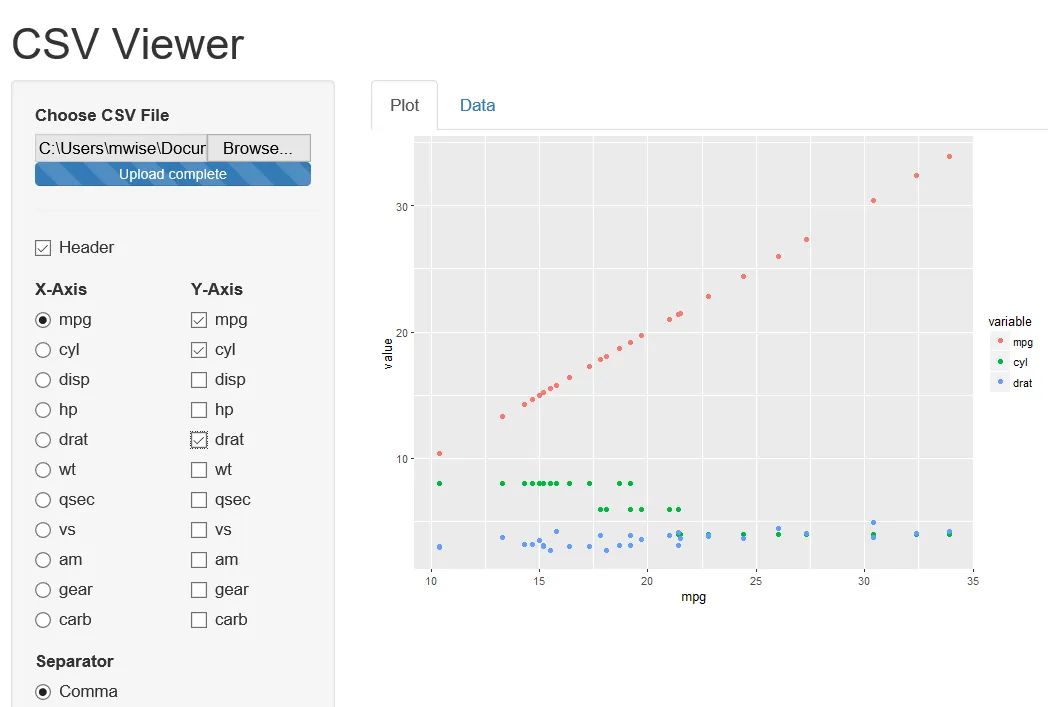
根据OP的要求(请参见接受答案中的评论),添加了一个从csv中读取并选择绘图轴的请求。也添加了一个额外的答案。

2个回答

6

这个回答仅解决了csv加载问题,有关使用ggplot进行绘图的解决方案请参见我下面的另一个答案。

因此(将文件合并为一个文件以便更容易处理后),我在ui部分添加了一个checkboxGroupInput,并在server部分添加了相应的updateCheckboxGroupInput。我需要在数据集更改时更新组,因此我对代码进行了重构,使data_set加载部分成为一个reactive,将updateCheckboxGroupInput封装在一个observer内部。

因此,这样做可以实现您想要的效果:

library(shiny)
library(shinydashboard)
library(leaflet)
library(data.table)

ui <- pageWithSidebar(
  headerPanel("CSV Viewer"),
  sidebarPanel(
    fileInput('file1', 'Choose CSV File',
              accept=c('text/csv', 'text/comma-separated-values,text/plain', '.csv')),
    tags$hr(),
    checkboxInput('header', 'Header', TRUE),
    checkboxGroupInput("inCheckboxGroup",
                       "Checkbox group input:",
                       c("label 1" = "option1",
                         "label 2" = "option2")),
    radioButtons('sep', 'Separator',
                 c(Comma=',',
                   Semicolon=';',
                   Tab='\t'),
                 ','),
    radioButtons('quote', 'Quote',
                 c(None='',
                   'Double Quote'='"',
                   'Single Quote'="'"),
                 '"'),
    uiOutput("choose_columns")
  ),
  mainPanel(
    tableOutput('contents')
  )
)

server <- function(input, output,session) {
  dsnames <- c()

  data_set <- reactive({
    req(input$file1)
    inFile <- input$file1
    data_set<-read.csv(inFile$datapath, header=input$header, 
                       sep=input$sep, quote=input$quote)
  })
  output$contents <- renderTable({
    data_set()
  })
  observe({
    req(input$file1)
    dsnames <- names(data_set())
    cb_options <- list()
    cb_options[ dsnames] <- dsnames
    updateCheckboxGroupInput(session, "inCheckboxGroup",
                             label = "Check Box Group",
                             choices = cb_options,
                             selected = "")
  })

  output$choose_dataset <- renderUI({
    selectInput("dataset", "Data set", as.list(data_sets))
  })

  # Check boxes
  output$choose_columns <- renderUI({
    # If missing input, return to avoid error later in function
    if(is.null(input$dataset))
      return()

    # Get the data set with the appropriate name

    colnames <- names(contents)

    # Create the checkboxes and select them all by default
    checkboxGroupInput("columns", "Choose columns", 
                       choices  = colnames,
                       selected = colnames)
  })
}
shinyApp(ui, server)

这是一张截图: enter image description here

这很棒。一个快速的问题,如果我想创建一个ggplot,使x轴始终是默认日期字段,并基于复选框组中选择的项目,该如何创建? - user1471980
我可以做到,并且很乐意添加它(但要等晚饭后:))。我会非常感激,因为我想要 ggplot2 的投票来获得徽章 :) - Mike Wise
我今天的精力快用完了 :) - Mike Wise
你能解释一下为什么你的 checkboxGroupInput 包含两个标签和选项的定义,但是:1)它们直到加载文件后才会显示出来2)加载文件后,方框的数量可以是任意的?为什么不限制为你设置的两个呢? - jzadra
我认为这个脚本在当前版本的shiny上无法工作。第二个答案中的组合脚本以及原始答案中的单独脚本都无法超出加载数据的范围。 - jzadra
显示剩余16条评论

5

所以为了满足另一个请求,我要添加另一个答案 - 它不仅读取文件,还允许您选择用于绘图的列,并在单独的选项卡中使用 ggplot2 进行绘制:

library(shiny)
library(shinydashboard)
library(leaflet)
library(data.table)
library(ggplot2)

ui <- pageWithSidebar(
  headerPanel("CSV Viewer"),
  sidebarPanel(
    fileInput('file1', 'Choose CSV File',
              accept=c('text/csv','text/comma-separated-values,text/plain','.csv')),
    tags$hr(),
    checkboxInput('header', 'Header', TRUE),
    fluidRow(
      column(6,radioButtons("xaxisGrp","X-Axis:", c("1"="1","2"="2"))),
      column(6,checkboxGroupInput("yaxisGrp","Y-axis:", c("1"="1","2"="2")))
    ),
    radioButtons('sep', 'Separator',
                 c(Comma=',', Semicolon=';',Tab='\t'), ','),
    radioButtons('quote', 'Quote',
                 c(None='','Double Quote'='"','Single Quote'="'"),'"'),
    uiOutput("choose_columns")
  ),
  mainPanel(
    tabsetPanel(
      tabPanel("Plot",plotOutput("plot")),
      tabPanel("Data", tableOutput('contents'))
    )
  )
)
server <- function(input, output,session) {
  dsnames <- c()

  data_set <- reactive({
    inFile <- input$file1

    if (is.null(inFile))
      return(mtcars)

    data_set<-read.csv(inFile$datapath, header=input$header, 
                       sep=input$sep, quote=input$quote)
  })

  output$contents <- renderTable({data_set()})

  observe({
    dsnames <- names(data_set())
    cb_options <- list()
    cb_options[ dsnames] <- dsnames
    updateRadioButtons(session, "xaxisGrp",
                             label = "X-Axis",
                             choices = cb_options,
                             selected = "")
    updateCheckboxGroupInput(session, "yaxisGrp",
                             label = "Y-Axis",
                             choices = cb_options,
                             selected = "")
  })
  output$choose_dataset <- renderUI({
    selectInput("dataset", "Data set", as.list(data_sets))
  })
  output$plot = renderPlot(
    {
      df <- data_set()
      gp <- NULL
      if (!is.null(df)){
        xv <- input$xaxisGrp
        yv <- input$yaxisGrp
        if (!is.null(xv) & !is.null(yv)){
          if (sum(xv %in% names(df))>0){ # supress error when changing files
            mdf <- melt(df,id.vars=xv,measure.vars=yv)
            gp <- ggplot(data=mdf) + 
               geom_point(aes_string(x=xv,y="value",color="variable"))
          }
        }
      }
      return(gp)
    }
  )
  output$choose_columns <- renderUI({

    if(is.null(input$dataset))
      return()
    colnames <- names(contents)
    checkboxGroupInput("columns", "Choose columns", 
                       choices  = colnames,
                       selected = colnames)
  }) 
}
shinyApp(ui, server)

屈服: 进入图片描述

希望能得到一些反馈。 - Mike Wise
抱歉回复晚了,我遇到了一个“错误:在数据中找不到ID变量”的问题,它抱怨列名。 - user1471980
好的,让我看看。是的,在加载文件时有一个错误。让我看看。 - Mike Wise
我在output$plot部分将mtcars更改为df,它可以工作。我有一个快速问题。假设我选择了一个包含日期或时间数据的列。这些数据以因子的形式出现,我应该如何格式化这些数据以便图表可读? - user1471980
我也发现了那个 Bug,并解决了另一个。对于你的问题,建议使用 lubridate 函数或 as.POSIXct 将其转换为日期。但是日期问题比较麻烦,我浪费了很多时间处理日期问题。 - Mike Wise
显示剩余8条评论

网页内容由stack overflow 提供, 点击上面的
可以查看英文原文,
原文链接