使用SVG绘制带箭头的块状图形

5
我需要使用SVG从一个点(x0,y0)绘制漂亮的带描边的块状箭头,连接到另一个点(x1,y1),就像图片上的那个。

arrow

我能想到的唯一方法是使用线条(基本上是两条线模拟描边和填充),再用标记进行标记,但由于重叠的笔画,它看起来有点丑陋。
理想情况下,线条和标记都应该用相同的颜色填充,并且应该具有相同的描边颜色,整体箭头宽度可以固定(但如果我也可以参数化它,那就太棒了)。基本上,它应该看起来与所提供的图片相同,并且只需提供两个点的坐标即可绘制。这种可能吗?

我猜你可以创建一个包含整个箭头路径的符号。你可以使用<use>标签和变换来把这个符号放在任何你想要的地方。 - Robert Longson
3个回答

9
我感到无聊,所以我写了一个函数来生成正确形状的路径。您只需提供“起点”和“终点”坐标、线宽、箭头宽度和箭头长度即可。祝愉快!

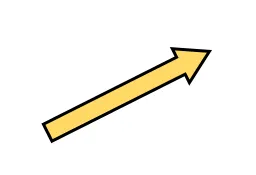
var from = {x: 50, y: 250};
var to = {x: 250, y: 100};

var lineWidth = 30;
var arrowheadWidth = 60;
var arrowheadLength = 50;

var svg = document.getElementById("test");

drawArrow(svg, from, to, lineWidth, arrowheadWidth, arrowheadLength);


function drawArrow(svg, from, to, lineWidth, arrowheadWidth, arrowheadLength)
{
  var dx = to.x - from.x;
  var dy = to.y - from.y;
  // Calculate the length of the line
  var len = Math.sqrt(dx * dx + dy * dy);
  if (len < arrowheadLength) return;

  // The difference between the line width and the arrow width
  var dW = arrowheadWidth - lineWidth;
  // The angle of the line
  var angle = Math.atan2(dy, dx) * 180 / Math.PI;
  // Generate a path describing the arrow. For simplicity we define it as a
  // horizontal line of the right length, and starting at 0,0. Then we rotate
  // and move it into place with a transform attribute.
  var d = ['M', 0, -lineWidth/2,
           'h', len - arrowheadLength,
           'v', -dW / 2,
           'L', len, 0,
           'L', len - arrowheadLength, arrowheadWidth / 2,
           'v', -dW / 2,
           'H', 0,
           'Z' ];
  var path = document.createElementNS("http://www.w3.org/2000/svg", "path");
  path.setAttribute("d", d.join(' '));
  path.setAttribute("transform", "translate("+from.x+","+from.y+") rotate("+angle+")");
  path.setAttribute("class", "arrow-line");
  svg.appendChild(path);
}
.arrow-line {
  fill: gold;
  stroke: black;
  stroke-width: 6;
}
<svg id="test" width="300" height="300">
</svg>


我们有相同的想法,只是你稍微快了一点;-) - Holger Will

3

最简单的方法是使用脚本创建箭头。 在这里,我只需从两个点p1和p2确定箭头的长度和角度,然后创建正确长度的简单路径,并将其旋转到计算出的角度:

svgns="http://www.w3.org/2000/svg"
function arrow(p1,p2){
  var h1=15 // line thickness
  var h2=35 // arrow height
  var w2=22 // arrow width
  var deg = Math.atan2(p1.y - p2.y, p1.x - p2.x) * (180 / Math.PI);
  var len = Math.sqrt(Math.pow(p1.y - p2.y,2)+Math.pow(p1.x - p2.x,2))
  var arr = document.createElementNS(svgns,"path")
  var d = `M${p1.x} ${p1.y-h1/2}v${h1}h${h2/2-len}v${(h2-h1)/2}l${-w2} ${-h2/2}l${w2} ${-h2/2}v${(h2-h1)/2}z`
  arr.setAttribute("d",d)
  arr.setAttribute("transform",`rotate(${deg} ${p1.x} ${p1.y})`)
  arr.classList.add("arrow")
  return arr
}

var a1 = arrow({x:50,y:50},{x:200,y:200})
var a2 = arrow({x:450,y:50},{x:300,y:200})
var a3 = arrow({x:450,y:450},{x:300,y:300})
var a4 = arrow({x:50,y:450},{x:200,y:300})
svg.appendChild(a1)
svg.appendChild(a2)
svg.appendChild(a3)
svg.appendChild(a4)
.arrow{stroke-width:3px}
.arrow:nth-of-type(1){fill:green;stroke:lime}
.arrow:nth-of-type(2){fill:red;stroke:orange}
.arrow:nth-of-type(3){fill:blue;stroke:turquoise}
.arrow:nth-of-type(4){fill:violet;stroke:pink}
<svg id="svg" viewBox="0 0 500 500" width="400" height="400">

</svg>

如果你试图找到一个不需要脚本的花哨解决方案,那么你就必须跳过很多循环...你至少需要4个箭头,每个箭头都指向左上角到右下角,从右上角到左下角,从左下角到右上角和从右下角到左上角...
这里有一个可行性证明,但我强烈建议不要这样做...

svg{overflow:visible;}
<svg width="200" height="200" style="overflow:visible" stroke="red" color="orange" opacity="0.5">
  <marker id="ah" viewBox="0 0 10 10" orient="auto" refX="10" refY="5" overflow="visible">
    <path d="M0 0L10 5L0 10z"  stroke-width="1"/>
  </marker>
  <marker id="ah2" viewBox="0 0 10 10" orient="auto" refX="10" refY="5">
    <path d="M0 0L10 5L0 10z" fill="currentColor" stroke="none"/>
  </marker>
  <marker id="block" viewBox="0 0 10 10" orient="auto" refX="9" refY="5">
    <rect x="0" y="0" width="10" height="10" stroke="white" stroke-width="1"/>
  </marker>
  <marker id="block2" viewBox="0 0 10 10" orient="auto" refX="9" refY="5">
    <rect x="0" y="0" width="10" height="10" stroke-width="5"/>
  </marker>
  <mask id="m1">
    <rect x="-10%" y="-10%" width="110%" height="110%" fill="white"/>
    <line x1="99.999%" y1="99.999%" x2="100%" y2="100%" stroke-width="20" marker-end="url(#block)"/>
  </mask>
  <line x1="0.001%" y1="0.001%" x2="0%" y2="0%" stroke-width="8" marker-end="url(#block2)"/>
  <line x1="0" y1="0" x2="100%" y2="100%" stroke-width="25"  mask="url(#m1)"/>
  <line x1="99.999%" y1="99.999%" x2="100%" y2="100%" stroke-width="20" marker-end="url(#ah)"/>
  <line x1="0" y1="0" x2="100%" y2="100%" stroke-width="20" stroke="currentColor" mask="url(#m1)"/>
  <line x1="99.999%" y1="99.999%" x2="100%" y2="100%" stroke-width="20" marker-end="url(#ah2)"/>
</svg>


2
在多次仔细检查所有数学计算之后:
在SVG defs标签中创建了一个归一化的箭头
然后根据提供的坐标缩放箭头。 (添加了静态高度XD)

document.addEventListener("DOMContentLoaded", function(event) {
  var svgDoc = document.getElementById("arrowSvg");
  var useArrow = svgDoc.getElementById("customArrow");
  var extraData = useArrow.getAttribute("extra:data");
  extraData = extraData.split(" ");
  var x1 = parseInt(extraData[0]);
  var x2 = parseInt(extraData[1]);
  var y1 = parseInt(extraData[2]);
  var y2 = parseInt(extraData[3]);
  var arrowHeight = 15;
  //Calculate the rotation needed
  var deltaY = y1 - y2;
  var deltaX = x2 - x1;
  var angle = Math.atan2(deltaY, deltaX) * (180 / Math.PI);
  //Distance between the two points.
  var distance = Math.sqrt(Math.pow(x2 - x1, 2) + Math.pow(y2 - y1, 2));
  useArrow.setAttribute("transform", 
                        "translate("+(x1+(deltaX/2))+" "+(y1-(deltaY/2))+") "+
                        "rotate(" + -1*angle +") " +
                        "matrix("+distance+", 0, 0, "+arrowHeight+", "+(0.5-distance*0.5)+","+(0.5-arrowHeight* 0.5)+")");

});
svg {
  width: 50%;
  border: 1px solid black;
}
.arrow {
  stroke: black;
  stroke-width: 0.05;
  fill: yellow;
}
<svg id="arrowSvg" viewBox="0 0 100 100" xmlns="http://www.w3.org/2000/svg" xmlns:xlink="http://www.w3.org/1999/xlink" xmlns:extra="ExtraNameSpace">>
  <defs>
    <path id="idArrow" class="arrow" d="M0,0.25 0.60,0.25 
                         0.60,0 1,0.5 0.60,1
                         0.60,0.75 0,0.75z" />
  </defs>
  <!--- Extra Data Param: x1 x2 y1 y2--->
  <use id="customArrow" xlink:href="#idArrow" extra:data="10 90 90 5" />

</svg>


网页内容由stack overflow 提供, 点击上面的
可以查看英文原文,
原文链接