在R中的apply结构循环中使用计数器

8
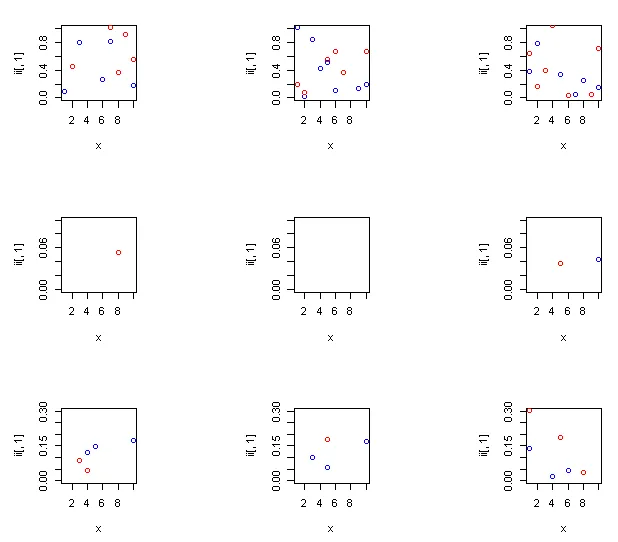
我正在尝试在R中从一个相当复杂的数组中绘图。我想生成一个3×3的图像,每个图像上都有红色和蓝色的点。
我使用了apply循环的结构,它可以工作,但是我想通过每一行来改变y轴的最大值。
通常我会在其他语言中使用一个计数器,比如i,在R中,apply的东西完全让我困惑!
par(mfrow=c(3,3),pty="s")             # a 3 by 3 graphic
set.seed(1001)

x <- 1:54                             # with 1 to 54 along the x axis

y <- array(rexp(20), dim=c(54,6,3,2)) # and the y axis coming 
                                      # from an array with dimensions as shown.

ymax <- c(1,0.1,0.3)                  # three different y maximum values I want 
                                      # on the graphic, one for each row of graphs

counter <- 1                          # a counter, starting at 1, 
                                      # as I would use in a traditional loop

apply(y[,3:5,,], 2, function(i)       # my first apply, which only considers
                                      # the 3rd, 4th and 5th columns
    {

    yy <- ymax[counter]               # using the counter to select my ylimit maximum

    apply(i, 2, function (ii)         # my second apply, considering the 3rd 
                                      # dimension of y
        {
            plot(x,ii[,1], col="blue", ylim=c(0,yy)) 

                                      # plotting the 4th dimension

                points(x,ii[,2], col="red") 

                                      # adding points in a different 
                                      # colour from the 4th dim. 

    })
})

非常感谢您的想法,我们非常感激!

祝好 凯特


如果您只想绘制图形等副作用,就不应该使用 apply。请使用 for 循环或重塑数据并使用 ggplot2 或 lattice。 - Roland
3个回答

16

我认为在这种情况下使用循环可能更容易些。另外,你的代码没有更新计数器的代码行,例如 counter <- counter + 1。从 apply 内部,你需要使用 <<- 分配到全局环境中,注意双重较小的 < 符号。以下是使用 lapply 的示例:

单个 lapply 的用法

counter <- 0
lapply(1:3, function(x) {
  counter <<- counter + 1
  cat("outer", counter, "\n")
  plot(1:10, main=counter)
})

或者对 lapply 进行嵌套使用

counter <- 0
lapply(1:3, function(x) {
  counter <<- counter + 1
  cat("outer", counter, "\n")
  lapply(1:3, function(x) {
    counter <<- counter + 1
    cat("inner", counter, "\n") 
    plot(1:10, main=counter)     
  })
})

嘿,谢谢,我以前从未使用过lapply,但我会尝试一下。我以前用的是循环,但速度非常慢,所以我改用了apply。还是谢谢你的提示。非常感谢。 - Kate2808

9

关键是要在索引上使用lapply而不是在数组本身上使用,这样你就可以使用索引来子集化你的y限制和内部循环之前的数组。这还避免了使用<<-结构。

简化一下你的数据:

par(mfrow=c(3,3),pty="s")             # a 3 by 3 graphic
set.seed(1001)
x <- 1:10                             # with 1 to 54 along the x axis
dims <- c(10,6,3,2)
y <- array(rexp(prod(dims)), dim=c(10,6,3,2)) # and the y axis coming 
ymax <- c(1,0.1,0.3)

lapply(1:3, function(counter, arr) {
  apply(
    arr[ ,counter + 2, , ], 2, 
    function(ii) {
      plot(x, ii[,1], col="blue", ylim=c(0,ymax[counter]))
      points(x, ii[,2], col="red") 
    } )
  },
  arr=y
)

enter image description here


太棒了,谢谢你。我还在努力理解不同的应用变体,这个例子很好地说明了它们之间的区别。再次感谢。 - Kate2808
@Kate2808,请看之前的评论,我忘记了除非我提到你,否则你不会收到通知。 - BrodieG

2

我不会重写你的代码,因为我必须说它很难理解,但是这可以帮助你:你可以使用<<-赋值在apply范围之外更新变量,例如更新一些外部的"计数器"


嘿,谢谢你关于<<-符号的提示。虽然我不是天生的程序员,但我以一种奇怪的方式喜欢它。所以感谢你的回答,我相信总有一天我的代码会更清晰易懂 :-) 干杯 - Kate2808

网页内容由stack overflow 提供, 点击上面的
可以查看英文原文,
原文链接