如何在Python中获取多边形内部的点列表?

26

我搜索了很多但找不到一个实用的答案来回答我的问题。我有一个多边形,例如:

    [(86, 52), (85, 52), (81, 53), (80, 52), (79, 48), (81, 49), (86, 53),
     (85, 51), (82, 54), (84, 54), (83, 49), (81, 52), (80, 50), (81, 48),
     (85, 50), (86, 54), (85, 54), (80, 48), (79, 50), (85, 49), (80, 51),
     (85, 53), (82, 49), (83, 54), (82, 53), (84, 49), (79, 49)]

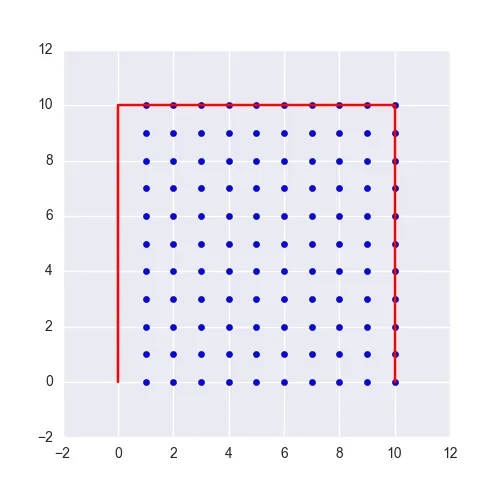
我想获取所有在这个边界多边形内部的点列表。我听说过关于多边形三角剖分技术或线性/洪水/交点/...填充算法的很多内容,但我确实想不出一个有效的实现方式。这个多边形很小,但是想象一下一个拥有10亿个点的多边形。我现在正在使用PIL绘制多边形并用循环在其中查找红色点。这是一种非常缓慢的技术:

def render(poly, z):
    xs = [i[0] for i in poly]
    ys = [i[1] for i in poly]
    minx, maxx = min(xs), max(xs)
    miny, maxy = min(ys), max(ys)
    X = maxx - minx + 1
    Y = maxy - miny + 1
    newPoly = [(x - minx, y - miny) for (x, y) in polygons]
    i = Image.new("RGB", (X, Y))
    draw = ImageDraw.Draw(i)
    draw.polygon(newPoly, fill="red")
    # i.show()
    tiles = list()
    w, h = i.size
    print w, h
    for x in range(w):
        for y in range(h):
            data = i.getpixel((x, y))
            if data != (0, 0, 0):
                tiles.append((x + minx, y + miny))

    return tiles

我正在寻找一种Pythonic的解决此问题的方式。
谢谢大家。


1
shapely 对你有什么帮助吗?https://pypi.python.org/pypi/Shapely - dm03514
我使用了Shapely,但是在这个问题上找不到任何解决方法。谢谢,我会去搜索一下。 - Farshid Ashouri
1
你可能正在寻找这个:http://rosettacode.org/wiki/Ray-casting_algorithm。 - Joel Cornett
1
好的,你链接中的函数提供了一个点和多边形来检查它是否在内部。这不是我需要的。我可以手动创建一个网格并循环所有项,但我正在寻找一种更直接的方法。顺便说一下,谢谢。 - Farshid Ashouri
@Farsheed,你找到问题的答案了吗?我现在正在寻找类似的解决方案,我有10万个点的坐标和几个多边形的坐标。我需要删除那些在这些多边形内部的点。 - Srivatsan
是的,我基于PiintInPoly算法编写了一个Python C模块。Shapely也有这个功能。 - Farshid Ashouri
5个回答

38

我建议使用matplotlib的contains_points()函数。

from matplotlib.path import Path

tupVerts=[(86, 52), (85, 52), (81, 53), (80, 52), (79, 48), (81, 49), (86, 53),
 (85, 51), (82, 54), (84, 54), (83, 49), (81, 52), (80, 50), (81, 48),
 (85, 50), (86, 54), (85, 54), (80, 48), (79, 50), (85, 49), (80, 51),
 (85, 53), (82, 49), (83, 54), (82, 53), (84, 49), (79, 49)]


x, y = np.meshgrid(np.arange(300), np.arange(300)) # make a canvas with coordinates
x, y = x.flatten(), y.flatten()
points = np.vstack((x,y)).T 

p = Path(tupVerts) # make a polygon
grid = p.contains_points(points)
mask = grid.reshape(300,300) # now you have a mask with points inside a polygon

1
你可以使用 np.indices() 函数来创建一个包含坐标的数组。 - lesolorzanov
1
这比使用shapely来评估多边形内的每个点要快得多。在处理1024x1024像素的图像时,使用shapely计算每个像素相对于多边形的内部或外部值需要4到6分钟。使用上述的matplotlib contains_points()函数,我只需要平均5秒钟就能完成。 - the_cat_lady
这也比在Shapely中使用MultiPoint(points).intersection(polygon)要快得多。 - Georgy

4

在RemcoGerlich的答案基础上,这里提供一个经过验证的函数:

import numpy as np
import mahotas

def render(poly):
    """Return polygon as grid of points inside polygon.

    Input : poly (list of lists)
    Output : output (list of lists)
    """
    xs, ys = zip(*poly)
    minx, maxx = min(xs), max(xs)
    miny, maxy = min(ys), max(ys)

    newPoly = [(int(x - minx), int(y - miny)) for (x, y) in poly]

    X = maxx - minx + 1
    Y = maxy - miny + 1

    grid = np.zeros((X, Y), dtype=np.int8)
    mahotas.polygon.fill_polygon(newPoly, grid)

    return [(x + minx, y + miny) for (x, y) in zip(*np.nonzero(grid))]

例子:

poly = [
    [0, 0],
    [0, 10],
    [10, 10],
    [10, 0]
]

plt.figure(None, (5, 5))
x, y = zip(*render(poly))
plt.scatter(x, y)
x, y = zip(*poly)
plt.plot(x, y, c="r")
plt.show()

enter image description here


3

我认为绘制多边形并填充它是一个不错的开始,你无论如何都需要这样的算法,而且这些算法通常在C语言中被优化得很好。但不要使用RGB图像,使用黑/白图像,并使用numpy.where()找到像素值为1的像素。

根据这个问题mahotas库有一个fill_polygon函数可以与numpy数组一起使用。

我从你的函数开始以下代码(我也会减去minxmaxx),但请注意,我无法测试它,因为不在我的开发机器上。

import numpy as np
import mahotas

def render(poly): # removed parameter 'z'
    xs = [i[0] for i in poly]
    ys = [i[1] for i in poly]
    minx, maxx = min(xs), max(xs)
    miny, maxy = min(ys), max(ys)
    X = maxx - minx + 1
    Y = maxy - miny + 1
    newPoly = [(x - minx, y - miny) for (x, y) in poly]           

    grid = np.zeros((X, Y), dtype=np.int8)
    mahotas.polygon.fill_polygon(newPoly, grid)

    return [(x + minx, y + miny) for (x, y) in np.where(grid)]

我正在测试它。第一点是应该是“from mahotas import polygon”。让我进一步测试它。 - Farshid Ashouri
好的,您的代码比PIL填充方法慢了38%。在1.3M个多边形的测试中,PIL需要5.6秒,而np + mahotas则需要6.7秒。 - Farshid Ashouri
哦,很酷。不过这只有不到38%的差异啊 :-)。你能用PIL填充多边形并使用np.where找到点吗?我认为PIL的图像也是numpy数组? - RemcoGerlich
1
我想知道有多少时间花费在减去minx和miny,然后再添加回来。不过,如果你的多边形具有任意索引,真的想不出避免它的方法。 - RemcoGerlich
我的问题是如何在图像中使用np.where。我们可以使用np.array(img)将图像转换为数组。但是如何使用where并将其转换回普通的瓷砖列表? - Farshid Ashouri
为了提高速度,你应该使用numpy数组来执行这些循环:newPoly = poly + [minx, miny]... - luispedro

2
您可以使用numpy矩阵作为二进制图像,例如可以与Opencv或其他图像处理库一起使用, 解决方案1 因此,可以使用大小为L x H的矩阵。
L=max(x) - min (x)
H=max(y) - min (y)

作为入口,我们有你之前提供的元组(x,y)列表,其名称为“poly”,例如:
import numpy as np
matrix =np.zeros((L,H),dtype=np.int32) # you can use np.uint8 if unsigned x ,y

现在我们有一个大小为L x H的矩阵,其中填充了0,现在我们将在多边形点位置上放置1。

我认为你可以简单地做到这一点。

matrix[poly]=1  # which will put 1 at each (x,y) of the list **poly**

我们将其解释为二进制(黑/白)图像,上面绘有轮廓。 假设我们想要检测到这个新的轮廓。
import cv2 # opencv import
ContoursListe,hierarchy = cv2.findContours(self.thresh,cv2.RETR_EXTERNAL,cv2.CHAIN_APPROX_NONE)
poly2=ContoursListe[0] # we take the first only contour

注意:poly2 包含你的多边形的所有顶点列表和组成它的所有点,即多边形的每个顶点的所有点,这是你需要查找有用信息的地方。 !! 你可以使用 cv2.CHAIN_APPROX_SIMPLE 参数来获取只包含多边形线段端点的 poly2,该参数更轻便且是我们的输入 :) 重要提示:poly2 的类型为 numpy 数组,其形状为 (n,1,2),而不是 (n,2)。
现在我们在此图像(矩阵)上绘制此轮廓并填充它 :) cv2.drawContours(matrix,[poly2],-1,(1),thickness=-1) thickness=-1 现在我们有了一个矩阵,在其中有一个1表示填充且形成多边形的每个点,“thickness=-1”强制填充此轮廓,您可以将 thickness=1 设置为仅获取边框。 如果你想进行平移,可以通过添加参数 offset(xtran,ytrans) 来实现。
要获取所有这些点的索引,只需调用
list_of_points_indices=numpy.nonzero(matrix)

解决方案2

更加聪明的方法是直接将您的点列表(poly)转换为轮廓格式(poly2),并在矩阵上绘制它。

poly2=poly.reshape(-1,1,2).astype(np.int32)

并将其绘制在矩阵matrix上

matrix =np.zeros((L,H),dtype=np.int32)

cv2.drawContours(matrix,[poly2],-1,(1),thickness=-1)

使用以下命令获取该点列表:

list_of_points_indices=numpy.nonzero(matrix)

通过调整线条粗细来填充或不填充多边形,有关更多详细信息,请参见解决方案1。


0
尝试使用以下代码。poly_coords是您的多边形坐标,“coord”是您想要检查是否在多边形内部的点的坐标。
def testP(coord, poly_coords):
    """
    The coordinates should be in the form of list of x and y
    """
    test1 = n.array(poly_coords)
    test2 = n.vstack((poly_coords[1:], poly_coords[:1]))
    test  = test2-test1
    m = test[:,1]/test[:,0]
    c = test1[:,1]-m*test1[:,0]
    xval = (coord[1]-c)/m
    print 'xVal:\t'; print xval
    print (test1[:,0]-xval)*(test2[:,0]-xval)
    check = n.where((xval>=coord[0])&((test1[:,0]-xval)*(test2[:,0]-xval)<0))[0]
    print check
    print len(check)
    if len(check)%2==0:
        return False
    else:
        return True

如果你想让它更快,可以将与多边形、斜率和偏移量相关的算法部分删除,然后使用“map”函数运行其余的代码。类似这样:

test1 = n.array( your polygon)
test2 = n.vstack((test1[1:], test1[:1]))
test  = test2-test1
m = test[:,1]/test[:,0]
c = test1[:,1]-m*test1[:,0]

def testP(coord):
    """
    The coordinates should be in the form of list of x and y
    """
    global test, test1, test2, m,c
    xval = (coord[1]-c)/m
    check = n.where((xval>=coord[0])&((test1[:,0]-xval)*(test2[:,0]-xval)<0))[0]
    if len(check)%2==0:
        return False
    else:
        return True
coords = n.array(( your coords in x,y ))
map (testP, coords)

如果你想的话,可以删除 'print' 命令。这段代码是为 Python 2.7 编写的。


请您解释一下“您的多边形”和“您的x,y坐标”。似乎“您的多边形”是指像“poly = [[0, 0], [0, 10], [10, 10], [10, 0]]”这样的东西。但我不知道“您的x,y坐标”具体是什么和如何使用! - mtoloo
对于多边形,您是绝对正确的。'x,y坐标'指的是要检查是否在多边形内的点的坐标。这些坐标应该是一个numpy数组,例如(5,6),其中点在x轴上的位置为5,在y轴上的位置为6。 - Ishan Tomar

网页内容由stack overflow 提供, 点击上面的
可以查看英文原文,
原文链接