当我尝试在matplotlib中使用LaTeX的amsmath包时,会遇到一堆令人费解的错误。是否有人能够让类似这样的东西正常工作?如果可以,请给我一个例子。
这是我尝试过的:
import matplotlib
from matplotlib import pyplot
from numpy import arange
x= arange(5)
y= x**1.5
matplotlib.rc('text', usetex = True)
matplotlib.rc('font', **{'family' : "sans-serif"})
params= {'text.latex.preamble' : [r'\usepackage{amsmath}']}
pyplot.rcParams.update(params)
fig= pyplot.figure(figsize=[10,7], dpi=120, facecolor=[1, 1, 1])
pyplot.plot(x, y, linewidth=2)
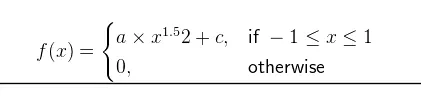
pyplot.title(r"""$f(x)=
\begin{cases}
\a*x^\{1.5\}2 + c,& \text{if } -1 \leq x \leq 1\\
0, & \text{otherwise}
\end{cases}""")
pyplot.show()
这段代码会产生以下错误:
RuntimeError: LaTeX was not able to process the following string:
'  \\\\begin{cases}'
Here is the full report generated by LaTeX:

This is pdfTeX, Version 3.14159265-2.6-1.40.18 (MiKTeX 2.9.6300 64-bit)
entering extended mode
(1727d2fa12a0305b2ddc30e92e4e21fa.tex
LaTeX2e <2017-04-15>
Babel <3.9r> and hyphenation patterns for 75 language(s) loaded.
("C:\Program Files\MiKTeX 2.9\tex\latex\base\article.cls"
Document Class: article 2014/09/29 v1.4h Standard LaTeX document class
("C:\Program Files\MiKTeX 2.9\tex\latex\base\size10.clo"))
(C:\Users\s117250\AppData\Roaming\MiKTeX\2.9\tex\latex\type1cm\type1cm.sty)
("C:\Program Files\MiKTeX 2.9\tex\latex\base\textcomp.sty"
("C:\Program Files\MiKTeX 2.9\tex\latex\base\ts1enc.def"))
("C:\Program Files\MiKTeX 2.9\tex\latex\amsmath\amsmath.sty"
For additional information on amsmath, use the `?' option.
("C:\Program Files\MiKTeX 2.9\tex\latex\amsmath\amstext.sty"
("C:\Program Files\MiKTeX 2.9\tex\latex\amsmath\amsgen.sty"))
("C:\Program Files\MiKTeX 2.9\tex\latex\amsmath\amsbsy.sty")
("C:\Program Files\MiKTeX 2.9\tex\latex\amsmath\amsopn.sty"))
("C:\Program Files\MiKTeX 2.9\tex\latex\geometry\geometry.sty"
("C:\Program Files\MiKTeX 2.9\tex\latex\graphics\keyval.sty")
("C:\Program Files\MiKTeX 2.9\tex\generic\oberdiek\ifpdf.sty")
("C:\Program Files\MiKTeX 2.9\tex\generic\oberdiek\ifvtex.sty")
("C:\Program Files\MiKTeX 2.9\tex\generic\ifxetex\ifxetex.sty")
("C:\Program Files\MiKTeX 2.9\tex\latex\geometry\geometry.cfg")

Package geometry Warning: Over-specification in `h'-direction.
    `width' (5058.9pt) is ignored.


Package geometry Warning: Over-specification in `v'-direction.
    `height' (5058.9pt) is ignored.

) (1727d2fa12a0305b2ddc30e92e4e21fa.aux)
("C:\Program Files\MiKTeX 2.9\tex\latex\base\ts1cmr.fd")
*geometry* driver: auto-detecting
*geometry* detected driver: dvips
! Missing $ inserted.
<inserted text>
                $
l.12 ...0000}{15.000000}{\sffamily   \begin{cases}
                                                  }

! LaTeX Error: \begin{cases} on input line 12 ended by \end{document}.

See the LaTeX manual or LaTeX Companion for explanation.
Type  H <return>  for immediate help.
 ...

l.13 \end{document}

(1727d2fa12a0305b2ddc30e92e4e21fa.aux)
! You can't use `\end' in internal vertical mode.
\enddocument ... \endgroup \deadcycles \z@ \@@end

l.13 \end{document}


! LaTeX Error: \begin{cases} on input line 12 ended by \end{document}.

See the LaTeX manual or LaTeX Companion for explanation.
Type  H <return>  for immediate help.
 ...

l.13 \end{document}

! Missing } inserted.
<inserted text>
                }
l.13 \end{document}

! Missing \right. inserted.
<inserted text>
                \right .
l.13 \end{document}

! Missing $ inserted.
<inserted text>
                $
l.13 \end{document}

)
! Emergency stop.
<*> ./1727d2fa12a0305b2ddc30e92e4e21fa.tex

No pages of output.
Transcript written on 1727d2fa12a0305b2ddc30e92e4e21fa.log.