有没有一种方法可以为每个数据集着色?
使用DataFrames有解决方案,但是对于没有DataFrames的情况呢?
我尝试过这个方法,但是它没有效果:
using Gadfly

plot(
  layer(x=1:10, y=1:10, Stat.step, Geom.line),
  layer(x=1:10, y=2:11, Stat.step, Geom.line),
  color=["red", "green"]
)
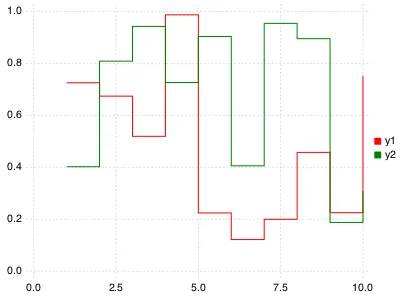
绘图不应该如此痛苦。以下是使用Gadfly后端在Plots中的操作:
using Plots; gadfly(size=(400,300))
plot(rand(10,2), line = ([:red :green], :step))
@GnimucK的评论展示了如何在交互式工作时完成此操作。然而,当您想将颜色作为参数传递给函数时,该方法会遇到一些困难。在我需要在运行时选择颜色的多行情况下,我有一个类似以下内容的函数:
using Compose, Gadfly
function my_plot_with_colors{T<:Number}(x::Vector{Vector{T}}, y::Vector{Vector{T}}, colorVec::Vector{ASCIIString})
    !(length(x) == length(y) == length(colorVec)) && error("Length mismatch in inputs")
    layerArr = Array(Vector{Layer}, length(x))
    for k = 1:length(x)
        layerArr[k] = layer(x=x[k], y=y[k], Geom.line, Theme(default_color=parse(Compose.Colorant, colourVec[k])))
    end
    return(plot(layerArr...))
end
如果x的长度为3,那么你的输入向量colourVec将会长这样:["red", "green", "blue"]。
layer(x=1:10, y=1:10, Stat.step, Geom.line, Theme(default_color=colorant"green"))。 - Gnimuc