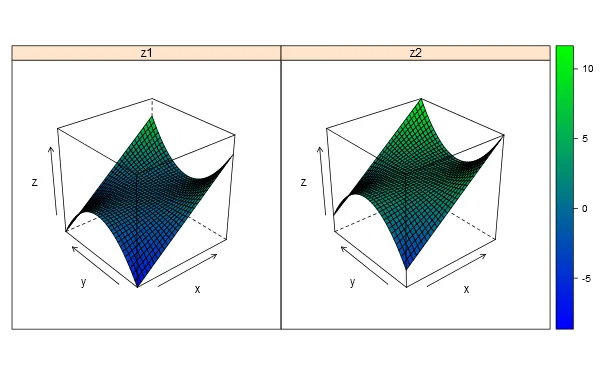
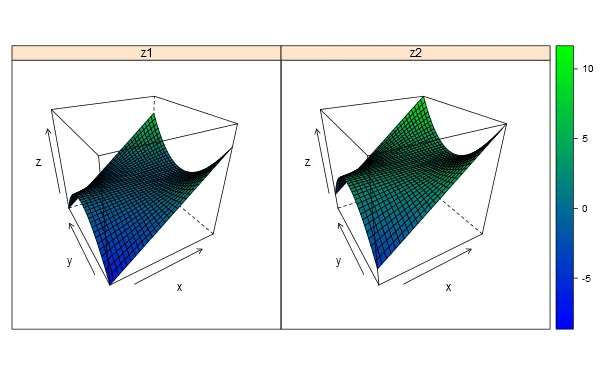
我正在创建一个面板,其中包含多个persp图,每个图都显示通过调整复杂回归模型中的预测变量生成的数据范围。我希望我的3D表面按照我的z变量进行颜色编码,这很容易实现。如何将此颜色比例尺扩展到涵盖面板中所有图中表示的所有z变量值的范围,以便可以比较多个persp图之间的颜色比例尺?
#colorized z scale, only a smidge modified from http://www.inside-r.org/r-doc/graphics/persp
par(bg = "white")
par(mfrow=c(1,2))
x <- seq(-1.95, 1.95, length = 30)
y <- seq(-1.95, 1.95, length = 35)
z1 <- outer(x, y, function(a, b) a*b^2)
nrz <- nrow(z1)
ncz <- ncol(z1)
# Create a function interpolating colors in the range of specified colors
jet.colors <- colorRampPalette( c("blue", "green") )
# Generate the desired number of colors from this palette
nbcol <- 100
color <- jet.colors(nbcol)
# Compute the z-value at the facet centres
zfacet <- z1[-1, -1] + z1[-1, -ncz] + z1[-nrz, -1] + z1[-nrz, -ncz]
# Recode facet z-values into color indices
facetcol <- cut(zfacet, nbcol)
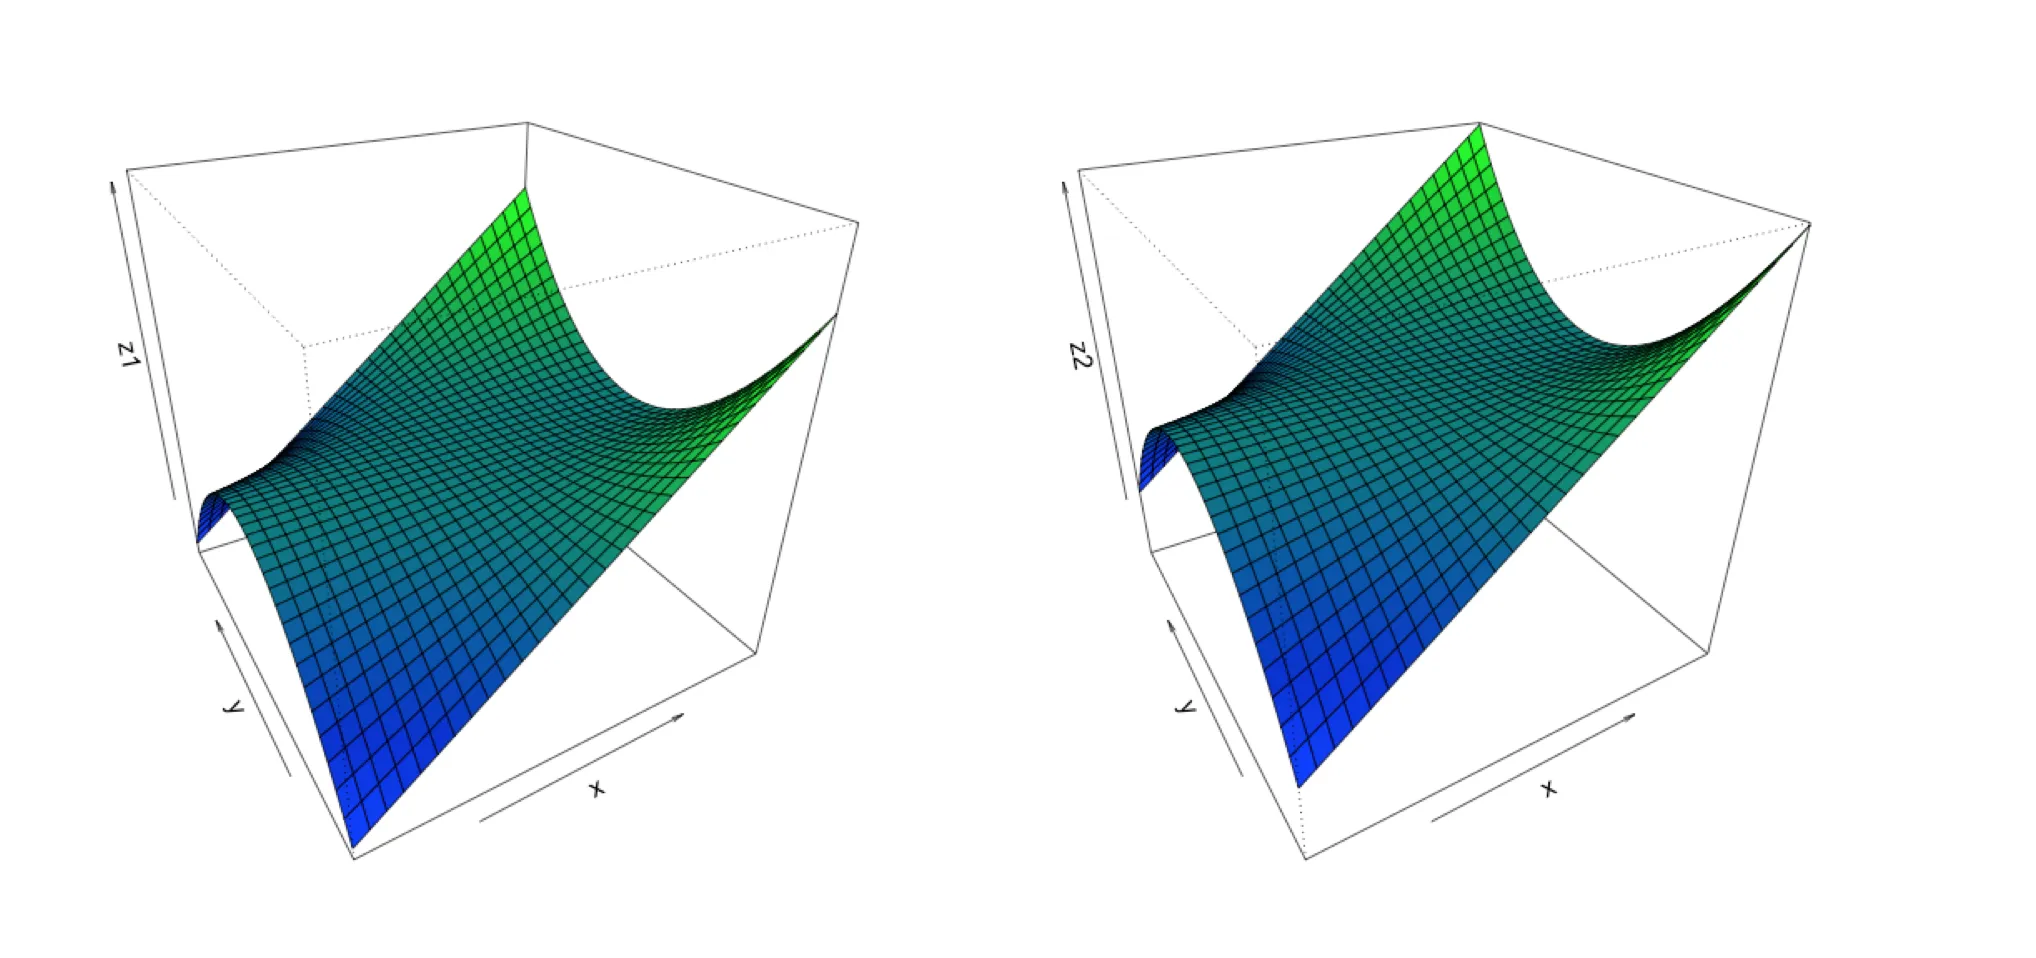
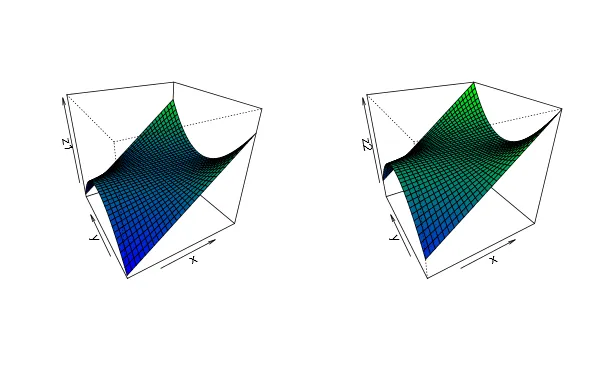
persp(x, y, z1, zlim=c(-8, 10.5), col = color[facetcol], phi = 30, theta = -30)
#zlim added to encompass combined ranges of z1 and z2
#exact same code, with different values of z
x <- seq(-1.95, 1.95, length = 30)
y <- seq(-1.95, 1.95, length = 35)
z2 <- outer(x, y, function(a, b) a*b^2+3)
nrz <- nrow(z2)
ncz <- ncol(z2)
# Create a function interpolating colors in the range of specified colors
jet.colors <- colorRampPalette( c("blue", "green") )
# Generate the desired number of colors from this palette
nbcol <- 100
color <- jet.colors(nbcol)
# Compute the z-value at the facet centres
zfacet <- z2[-1, -1] + z2[-1, -ncz] + z2[-nrz, -1] + z2[-nrz, -ncz]
# Recode facet z-values into color indices
facetcol <- cut(zfacet, nbcol)
persp(x, y, z2, zlim=c(-8, 10.5), col = color[facetcol], phi = 30, theta = -30)
#zlim added to encompass combined ranges of z1 and z2
#comparing the values, we see that there's different, overlapping scales from z1 and z2
summary(as.vector(z1))
summary(as.vector(z2))
因此,当您查看z2的两个图时,您会发现它们在某种程度上处于不同的比例尺上。如果我可以让颜色比例尺覆盖z1和z2的范围,那将更加清晰。