Excel中设置PlotArea.Width时出错,VBA (Excel 2010)。

6

我在子程序中尝试设置图表的plotarea.width属性时遇到了错误。

enter image description here

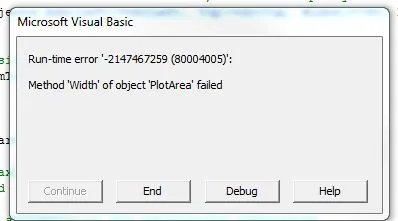
如果我注释掉前面的行,其他维度也会导致此错误。没有ActiveChart、选择等。具体的错误消息是这样的:"-2147467259 (80004005) Method 'Width' of object 'PlotArea' failed"

这让我感到困惑的原因有几个:

  • 在调试模式下,通过F8逐步执行代码时不会出现错误。
  • 据我所知,“width”不是图表的plotarea的“方法”,而是“属性”,因此即使是错误消息本身也相当模糊。

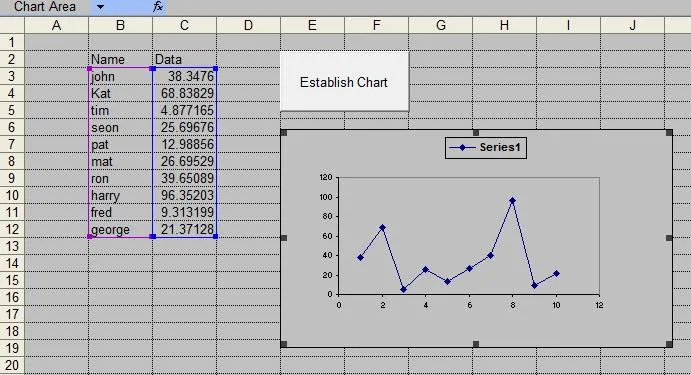
有什么想法吗?以下是我能分享的所有代码,完整的ChartSizeMedium子程序和一个虚拟片段,展示了我如何建立图表并将其传递给该子程序,在将图表传递给另一个函数添加系列数据之前设置大小和一些其他属性。

    Option Explicit
    Private Sub EstablishChartObject()
    Dim cObj as ChartObject
    Set cObj = ActiveSheet.ChartObjects.Add(Left:=30, Top:30, Width:=740, Height:=300)
        ChartSizeMedium cObj.Chart, "Integer", "Example Chart Title"
    End Sub
    Private Sub ChartSizeMedium(cht As Chart, NumType As String, Optional chtTitle As String)
    'Subroutine to make a consistent size chart
    Dim s As Long
    With cht
    'Add a chart title if one exists.
        If Len(chtTitle) > 0 Then
        .HasTitle = True
        .chartTitle.Characters.Text = chtTitle
        End If
    'Create the default chart Legend
        .HasLegend = True
        With .Legend
        .Position = xlTop
        .Font.Size = 11
        .Font.Bold = True
        End With
    'Format the axes
        .Axes(xlValue).MajorGridlines.Format.Line.Visible = msoFalse
        .Axes(xlValue).MinorGridlines.Format.Line.Visible = msoFalse

    'Format the size of the chart
        With .Parent
        .Width = 740
        .Height = 396
        End With

        With .PlotArea
        .Width = 640    '<---- THIS LINE TRIGGERS THE ERROR
        .Height = 280
        .Left = 30
        .Top = 30
        End With
    End With
    'Some charts start with more than one series container, so make sure they're gone:
    With cht
    Do Until .SeriesCollection.Count = 0
    s = .SeriesCollection.Count
    .SeriesCollection(s).Delete
    Loop
    End With
    End Sub

2012年12月12日更新

我删除了所有没有问题的代码,并仅使用PlotArea块,在相同的例程中,我还尝试设置图表类型(几个值),并如此示例所示,在尝试设置PlotArea尺寸之前手动添加了一系列数据,但错误仍然存在:

Option Explicit
Private Sub EstablishChartObject2()
    Dim cObj As ChartObject
    Dim sh As Worksheet

    Set sh = ActiveSheet
    Dim srs As Series
    Set cObj = sh.ChartObjects.Add(Left:=30, Top:=30, Width:=740, Height:=300)
    Set srs = cObj.Chart.SeriesCollection.NewSeries

    srs.Values = "={1,3,5,7,4}"
    cObj.Chart.ChartType = 57

    With cObj.Chart.PlotArea
        .Width = 100   '<---- THIS LINE TRIGGERS THE ERROR
        .Height = 280
        .Left = 30
        .Top = 30
    End With

End Sub

只是随便一说,这是否发生在某些图表类型上?也许是没有绘图区域的图表类型(如果这种类型真的存在的话...) - Scott Holtzman
这个线程讨论了一个类似的问题和刷新时间问题:http://www.excelforum.com/excel-programming-vba-macros/746724-method-width-of-object-plotarea-failed.html。你必须登录才能看到Andy Pope的解决方案,所以我不知道它是什么,但既然是Andy的,我相信它有效。这个线程说他们通过重新打开ScreenUpdating来解决了这个问题:http://www.vbaexpress.com/forum/archive/index.php/t-17251.html。不知道是否适用于你。 - Doug Glancy
你可以注释掉这行 width 代码,看看是否会出现错误在其它行吗? - bonCodigo
@DougGlancy 在这个子程序中已经将 ScreenUpdating=True 设置为真,因此重新打开它不是一个问题(虽然在搜索错误时我曾看到这个建议,并尝试了调整 ScreenUpdating 的值,但无济于事)。 - David Zemens
@bonCodigo 是的,如果我注释掉 width,那么下一行的 .height 就会出现错误。错误代码和信息是完全模糊的。这对你有帮助吗?我似乎可以通过选择绘图区域,然后立即取消选择(这样错误就不会跳到 height),但我希望能在不进行“选择”的情况下完成此操作。 - David Zemens
显示剩余2条评论
6个回答

5
我遇到了类似的问题。这明显是 Excel 的问题(使用的是 2013 版本)。
With .PlotArea 
    .Select 'err if delete this line of code
    .Top = 0
    .Left = 0
    .width = 40
    .Height = 40 
End With

如果您删除.select行,则会在下一行出现错误。 请注意,我不使用<with selectiondo stuff>。 .select使其正常工作,而不使用选择显然是Excel的错误(来自以前的版本?)


我正在使用Excel 2010,你的解决方案也帮了我。 - Lati
同样适用于Excel 2016。它很有帮助 :) - M_Tornack

4

有两种解决方案似乎都有效,但都不是我所期望的“优雅”(我希望能通过选择图表或其任何部分来完成此操作)。

选项1 - 选择绘图区域,然后取消选择。这似乎是最可靠/高效的解决方案。

With .PlotArea
    Application.ScreenUpdating = False
   .Select
    With Selection
        .Width = paWidth
        .Height = paHeight
        .Left = paLeft
        .Top = paTop
        ActiveSheet.Range("A1").Activate
    End With
    Application.ScreenUpdating = True
End With

选项2 - 在循环中禁用错误处理(这是从Doug的链接中得出的)。这似乎不是一种非常可靠或有效的方法,尽管它似乎可以工作,但我知道在该循环中,每个属性都会在成功设置它们之前失败一次。

With .PlotArea
    For pLoop = 1 To 5
        On Error Resume Next
        .Width = paWidth
        .Height = paHeight
        .Left = paLeft
        .Top = paTop
        On Error GoTo 0
    Next
End With

顺便说一下,您可以将您的尝试附加到问题中。建议您不要更改原始帖子,除非有缺少信息的评论。请保留您的原始帖子,并在其下方打开更新,例如更新1、2。 - bonCodigo

1
希望你的工作表和图表能够达到宽度最大为640。如果是这样,可以尝试使用明确引用。同时建议将宽度(width)高度(height)值更改为较低的值,并查看程序的响应情况。既然你说当你选择(select)时它可以工作,
  • 也就意味着你的cht正在包装正确的图表对象——除非你使用ActiveChart.PlotArea.Width选中了图表。因此,我猜明确引用可能会是一个潜在的尝试。

,

cht.PlotArea.Width = 640
cht.PlotArea.Height = 280
cht.PlotArea.Left = 30
cht.PlotArea.Top = 30

此外,请检查纵横比的锁定或解锁。如果这些方法都不起作用,那么请在您的工作表中添加一个图表,并使用最简单的图表格式代码来检查宽度、高度、左侧、顶部的变化。

更新二

让我们在第二个sub中尝试指定图表类型并设置图表对象。我在我的端上尝试过,它可以工作。请尝试使用以下更改的代码。

代码: 从工作表中显示的按钮调用此子程序。

Option Explicit

  Public Sub EstablishChartObject()
  Dim mySheet As Worksheet
  Dim cObj As ChartObject

    Application.ScreenUpdating = False
    Application.StatusBar = "Chart is coming soon..."

    Set mySheet = Sheets(2) '-- set according to yours
    '-- create chart with some source data first, which you can change later
    Set cObj = mySheet.ChartObjects.Add(Left:=30, Top:=30, Width:=400, Height:=200)
    ChartSizeMedium cObj, "Integer", "Example Chart Title"
        
  End Sub


  'Subroutine to make a consistent size chart
  Private Sub ChartSizeMedium(chtObj As ChartObject, NumType As String, _
                                  Optional chtTitle As String)
    
  Dim myChart As Chart
  Dim s As Long
    
     Set myChart = chtObj.Chart '-- specify chart type
     myChart.SetSourceData Source:=Sheets(2).Range("B3:C12")  '-- set to what you have
     myChart.ChartType = xlXYScatterLines  '-- set to the type you want 
                                          'and make sure to **use correct properties**

        With myChart
            If .HasTitle Then
                .ChartTitle.Characters.Text = chtTitle
            End If
        
            'Create the default chart Legend
            If .HasLegend Then
                With .Legend
                    .Position = xlTop
                    .Font.Size = 11
                    .Font.Bold = True
                End With
            End If
            
            'Format the axes
            With .Axes(xlValue)
                .HasMajorGridlines = False
            End With
                    
            'Format the size of the chart
            With .Parent
                .Width = 400 '-- change to yours
                .Height = 250 '-- change to yours
            End With
    
            With .PlotArea
                .Width = 300 '-- change to yours
                .Height = 180 '-- change to yours
                .Left = 30
                .Top = 30
            End With
    End With

    Application.ScreenUpdating = True
    Application.StatusBar = "Chart is Here!"

End Sub

输出:

enter image description here

请确保为每种图表类型使用正确的属性。请注意,上面的代码不会删除工作表中剩余的旧图表。

.MajoreGridlines.Format.Lines.Visible 失败。因此,设置 .MajorGridlines = False 以确保您不想显示网格线。 您想要做的其他任何事情都可以稍后完成。最初只需尝试更改维度。

参考来源:MSDN Gridlines property


我无法将其转换为小写,因为VBA编辑器会自动重新格式化为正确的大小写,例如“Width”等。创建图表对象时,默认情况下解锁纵横比。我试图隔离错误,如果我注释掉其他行,则所有四个维度(宽度、高度、顶部、左侧)都会出现此错误。即使对cht.PlotArea.Width...进行明确引用,错误仍然存在。 - David Zemens
抱歉,误读了“lower”。如果1=是,则2=否。除非我选择plotarea,否则所有维度属性的PlotArea都会出现错误。3-是的。而且?cobj.Chart.PlotArea.Width返回的默认宽度大于640。我尝试过宽度小至250,但仍然出现相同的错误。4-无论工作表上存在多少图表,问题都会持续存在。5-不确定这是什么意思。6-请参见OP以获取cObj的声明。 - David Zemens
你的代码中有使用 Option Explicit 吗?我没有看到 Dim cObj as chart - bonCodigo
@DavidZemens 请查看最新更新。我抽出了一些时间来尝试你的代码,似乎没有太多错误。但是设置表格和图表类型可能是关键。另外,如你所提到的,你的网格线禁用代码存在错误。期待听到你的意见。 - bonCodigo
我相信今天早上我添加到OP的更新已经包含了您建议的更改,并为了简化事情,我只在创建chartobject的相同子程序中放置了有问题的with块。对我来说,这段代码仍然失败,如果它对您有效,我将不得不假设我的本地机器上的某些东西导致了失败。值得注意的是,此图表不使用工作表中包含的源数据,系列数据是通过另一个子程序从Python对象接收变量数组数据进行编程添加的。 - David Zemens
显示剩余6条评论

1
我知道这篇文章有些过时,而且这个解决方法看起来不太好,但它是有效的。我只是根据你提到的逐步检查的方法来尝试做到的。
Option Explicit

Sub chart()

Dim cObj As ChartObject
Dim sh As Worksheet

Set sh = ActiveSheet
Dim srs As Series
Set cObj = sh.ChartObjects.Add(Left:=30, Top:=30, Width:=740, Height:=300)
cObj.chart.ChartType = 57
Set srs = cObj.chart.SeriesCollection.NewSeries
    srs.Values = "={1,3,5,7,4}"
Application.Wait Now + TimeValue("00:00:01") '<~~ Added This line
With cObj.chart.PlotArea
    .Width = 100
    .Height = 280
    .Left = 30
    .Top = 30
End With
End Sub

太好了!应用程序现在完全使用PPT,但是同样的错误仍然存在。我不得不稍微修改一下,使用“计时器”来代替PPT中没有的“Application.Wait”。我已经测试过这个解决方案,似乎可以正确地暂停1秒钟。 - David Zemens
你甚至可以将它缩短到四分之一秒或者一半,我没有进行太多的实验,但如果你感觉一秒钟似乎比你已经设置的时间慢,或者只是想让它更快,你可以尝试缩短等待/计时器。 - user2140261
我能够稍微修改这个,并将暂停放在一个错误陷阱中,这样可以重试并每隔0.5秒增加等待时间。目前似乎可以工作。谢谢建议! - David Zemens

1

编辑: 这似乎对于一些图表类型有效,但仍然无法解决其他图表类型的问题。我继续使用带有On Error Resume Next的5x循环,这似乎是目前最可靠的解决方案。

原文: 这是基于User2140261在上面提出的建议答案:

https://dev59.com/GGvXa4cB1Zd3GeqPOO2O#16041640

自从这个问题最初发布以来,应用程序现在驻留在PowerPoint中,因此我无法使用Applicaiton.Wait。我进行了一秒钟的暂停,但有时会出现间歇性错误,而三秒钟的暂停时间太长了,因此我构建了以下错误处理程序。相同的想法可以与Application.Wait结合在Excel中使用。这是导致我困扰的代码块,因此我添加了这个Powerpoint中的错误处理程序来模仿Application.Wait
RetryChartDimensions:
On Error GoTo ErrChartDimensions
With .PlotArea
    .Width = paWidth
    .Height = paHeight
    .Left = paLeft
    .Top = paTop
End With
On Error GoTo 0

' More code
' more code

Exit Sub 'gracefully exit this subroutine before the error-handling.'

ErrChartDimensions:
Err.Clear
'Pause before setting the PlotArea dimensions:'
Dim wtTime As Double
Dim startTime As Long

'A maximum 3 second delay should be more than enough time.
If wtTime < 3 Then
    wtTime = wtTime + 0.5
    startTime = Timer
    While Timer < startTime + wtTime
        DoEvents
    Wend
End If
Resume RetryChartDimensions

End Sub

0

我没有足够的声望来添加评论,所以使用上述解决方案,我已经修复了在VB.Net 2010和Excel 2013中使用饼图时遇到的问题。xlLine图表从未引起过问题,但当相同的代码针对Excel 2013上的xlPie图表运行时,我的代码会崩溃(在Excel 2007上一切正常)。

现在我的代码可以正常工作:

    appExcel.Visible = False
    xlchart_for_96_Well_Plate_Source = appExcel.Charts.Add(After:=wkbExperiment_Details.Sheets(wkbExperiment_Details.Sheets.Count))
    appExcel.ScreenUpdating = False

    With xlchart_for_96_Well_Plate_Source
            .SetSourceData(Source:=wksData.Range(wksData.Cells(2, byteCharts_added), wksData.Cells(intUsed_Rows, byteCharts_added)), PlotBy:=Microsoft.Office.Interop.Excel.XlRowCol.xlColumns)
            .ChartType = objChart_Type
            .PlotArea.Select() 
            .PlotArea.Top = 2
            .PlotArea.Select()
            .PlotArea.Left = 2
            .SeriesCollection(.SeriesCollection.count).xvalues = wksData.Range(wksData.Cells(2, 1), wksData.Cells(intUsed_Rows, 1)).Value ' Scale - wavelength for line chart
            .SeriesCollection(.SeriesCollection.count).Values = wksData.Range(wksData.Cells(2, byteCharts_added + 1), wksData.Cells(intUsed_Rows, byteCharts_added + 1)).Value
            .SeriesCollection(.SeriesCollection.count).Name = wksData.Cells(1, .SeriesCollection.count + 1).value
    End With
appExcel.ScreenUpdating = True

网页内容由stack overflow 提供, 点击上面的
可以查看英文原文,
原文链接