使用data.table对每月序列进行汇总(计算特定事件的数量)

3
我希望这是一个可以接受的R/data.table问题。
我有一个三列表格,包括:
- id:地理位置ID(303,453个位置) - month:1990-2014年间的25个月份 - spei:气候指数,变化范围为-7到7。
我需要计算每个位置在整个1990-2014年期间干旱事件的发生次数。干旱事件被定义为“SPEI连续为负且达到-1.0或更低值的时期。当SPEI首次降至零以下时开始出现干旱,并在-1.0或更低值后第一个正SPEI值出现后结束。”
我知道可以使用shift()和rolling joins来实现,但非常希望得到一些帮助!
# Sample table structure
dt <- data.table(
  id = rep(1:303453, each=25*12),
  month = rep(seq(as.Date("1990-01-01"), as.Date("2014-12-31"), "month"), 303453),
  spei = runif(303453*25*12, -7, 7))

# A minimal example with 1 location over 12 months
library(data.table)
library(xts)

dt <- data.table(
  id = rep("loc1", each=12),
  month = seq(as.Date("2014-01-01"), as.Date("2014-12-31"), "month"),
  spei = c(-2, -1.1, -0.5, 1.2, -1.2, 2.3, -1.7, -2.1, 0.9, 1.2, -0.9, -0.2))

spei.ts <- xts(dt$spei, order.by=dt$month, frequency="month")
plot(spei.ts, type="bars")

enter image description here

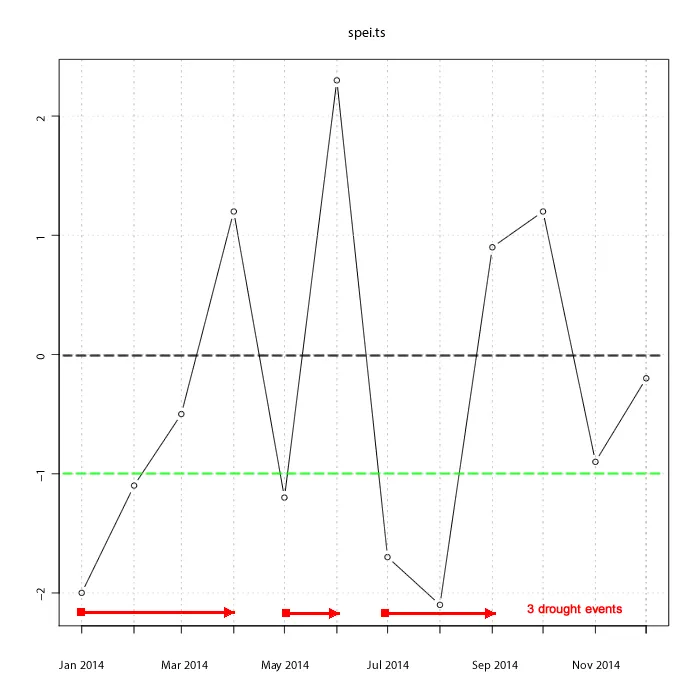
这张图片展示了一个1年期间发生的3次干旱事件。我需要识别并计数这些事件。

希望有些人更习惯于处理时间序列。

非常感谢,--Mel。


1
请附上一个小的可重现的示例和期望的输出,以便更容易地理解和交叉检查。 - akrun
1
我怀疑 rep(1:303453, each=25*12) 能否被视为一个小型可重现的示例。 - David Arenburg
2个回答

2
这里是开始获得您想要的结果的起点。 也许专家可以建议提高速度的改进。
编辑:通过删除paste,速度提高了约8倍。
library(data.table)
set.seed(42)
n <- 300  # 303453 will be ~1000 times slower
dt <- data.table(
    id = rep(1:n, each=25*12),
    month = rep(seq(as.Date("1990-01-01"), as.Date("2014-12-31"), "month"), n),
    spei = runif(n*25*12, -7, 7))

system.time({
  dt[, `:=`(neg = (spei < 0), neg1 = (spei <= -1))]
  dt[, runid := ifelse(neg, rleid(neg), NA)]
  res <- dt[!is.na(runid), 
            .(length = .N[any(neg1)], start = min(month), end = max(month)), 
            by = .(id, runid)][!is.na(length)]

})
#    user  system elapsed 
#   0.345   0.000   0.344 

# counts of droughts per id:
res[, .(nDroughts = .N), by = id]

# list of droughts per id: (NB: don't include 1st positive value after) 
res[, .(droughtN = seq_len(.N), start, end), by = id]

这是一个很好的方法,而且速度很快,但我认为它还不完全正确。看一下dt[ id == 1 & year(month) %in% 2006:2007 ] -- 这里有一个运行,在"2006-12-01"而不是"2007-01-01"开始。它是在小于-1而不是小于零时开始的。 - Frank
@Frank,在问题中写道:“当SPEI首次降至零以下时,干旱开始……”,因此我不同意。 - Max
@Max,这看起来很不错,在我的9200万行真实数据表上运行时间不到12秒!我以前从未使用过rleid()。非常感谢你指出这个函数。 - mbacou

2

基于评论更新...

如果只需要计数,则

# Let 'sp' = starting point of potential drought
# Let 'dv' = drought level validation
# The cumsum just gives unique ids to group by.
dt[, sp := (spei <= 0) & (shift(spei, fill = 1) > 0), by = id]
dt[, dv := min(spei) <= -1, by = .(id, cumsum(sp))]
dt[sp & dv, .N, by = id]

然而,正如评论中所述,您已经使用过shift,因此您已经知道它的用法。既然您喜欢将日期标识出来的想法,为什么不在那里也使用shift呢?

# Extending the previous columns...
dt[, ep := (shift(spei, type = "lead", fill = 1) > 0) & (spei <= 0), by = id]
cbind(dt[sp & dv, .(start = month), by = id],
      dt[ep & dv, .(end = month), by = id][,id := NULL])

如果您希望日期与图中的红线所示相同,只需添加一个月,除非是最后一个月。我们还可以获取长度...

# Extending the previous columns again...
dt[, end.month := shift(month, type = "lead", fill = month[.N]), by = id]
dt[, orig.id := .I]
starts <- dt[sp & dv][, did := .I]
ends <- dt[ep & dv][, did := .I]
starts[ends, on = "did"][
  ,.(id = id, length = 1 + i.orig.id - orig.id, start = month, end = i.end.month)]

会产生
     id length      start        end
1: loc1      3 2014-01-01 2014-04-01
2: loc1      1 2014-05-01 2014-06-01
3: loc1      2 2014-07-01 2014-09-01

而且它仍然快速!当n=300

> microbenchmark(max = max.full(copy(dt))[, .(nDroughts = .N), by = id],
+                thellcounts = thell.counts(copy(dt)),
+                thell .... [TRUNCATED] 
Unit: milliseconds
        expr       min        lq      mean    median        uq        max neval
         max 218.19152 220.30895 342.18605 222.75507 250.36644 1350.15847    10
 thellcounts  20.36785  22.27349  28.45167  23.39313  24.38610   78.25046    10
  thelldates  28.24378  28.64849  30.59897  30.57793  31.25352   34.51569    10
 thelldates2  36.19724  39.79588  42.34457  41.52455  42.41872   57.28073    10

n=3000

> microbenchmark(max = max.full(copy(dt))[, .(nDroughts = .N), by = id],
+                thellcounts = thell.counts(copy(dt)),
+                thell .... [TRUNCATED] 
Unit: milliseconds
        expr       min        lq      mean    median        uq       max neval
         max 2126.1138 2148.3453 2207.7801 2205.3536 2241.2848 2340.1203    10
 thellcounts  197.7312  202.4817  234.2949  205.4828  304.1556  309.1028    10
  thelldates  261.9889  264.5597  283.9970  266.1244  267.8603  374.6406    10
 thelldates2  320.6352  331.7558  374.4110  340.2668  439.1490  441.8473    10

是的,这也是我的第一种方法,计算我们看到从负SPEI指数转变为正指数的次数,然后确定哪些负连续出现也低于“-1”。按“cumsum(sp)”分组很聪明。@Max上面的方法还具有确定起始和结束月份的额外好处,这也非常有用。 - mbacou

网页内容由stack overflow 提供, 点击上面的
可以查看英文原文,
原文链接