我正在阅读这个问题和这个问题,涉及在ggplot2轴标签中使用\n和expression,但似乎对于标题(或多行表达式)不起作用。
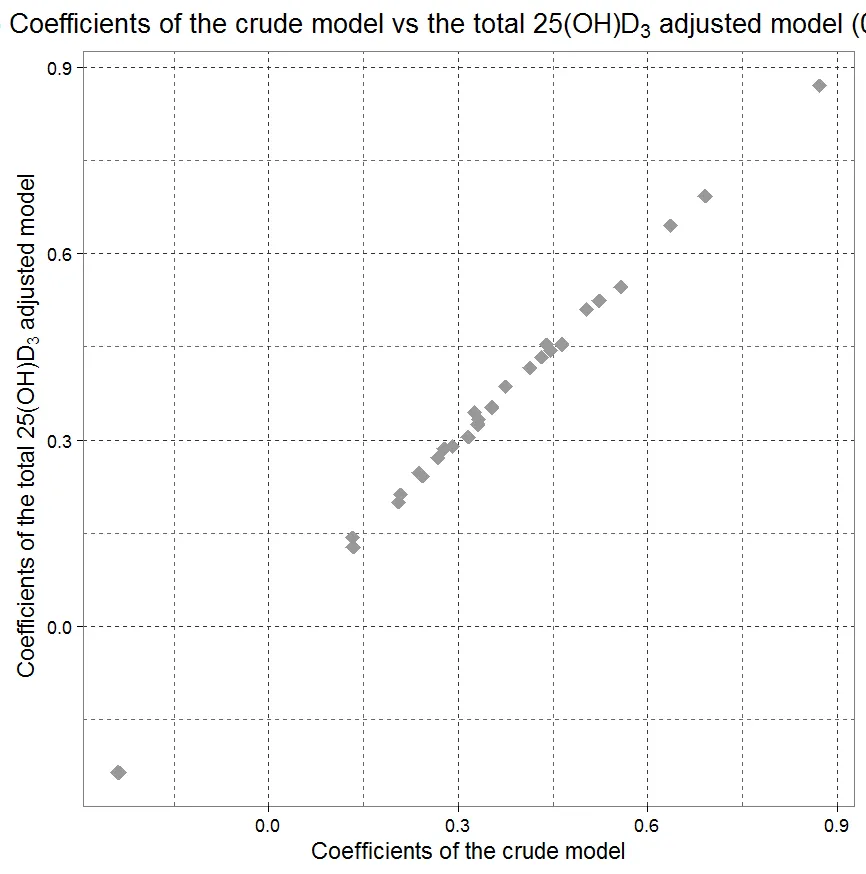
我的原始图如下:
ggplot(data = fig3, aes(x=crude_beta_time6, y=vidD_beta_time6)) +
geom_point(shape=18, size=5, color="gray60") + xlab("Coefficients of the crude model") +
ylab(bquote("Coefficients of the total 25(OH)D"[3]~"adjusted model")) +
theme_bw(base_size = 17) + theme(
panel.grid.major = element_line(color = "gray20", size = 0.3, linetype = "dashed"),
panel.grid.minor = element_line(color = "gray40", size = 0.3, linetype = "dashed")
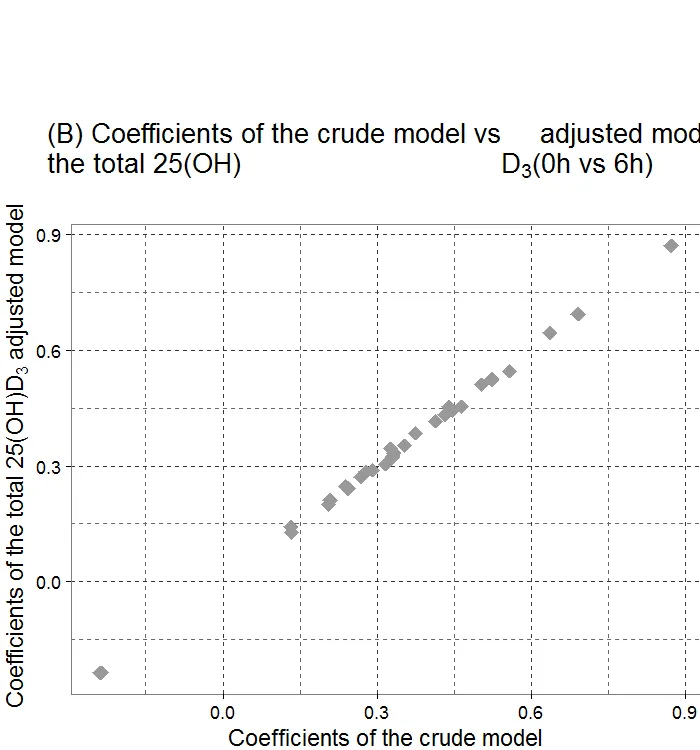
) + ggtitle(expression(paste("(B) Coefficients of the crude model vs the total 25(OH)", D[3]," adjusted model (0h vs 6h)", sep="")))
然而,标题太长了,因此我尝试使用引用的问题中推荐的atop命令来放置两个换行符:一个在vs和the之间,另一个在model和(0h vs 6h)之间。
ggplot(data = fig3, aes(x=crude_beta_time6, y=vidD_beta_time6)) +
    geom_point(shape=18, size=5, color="gray60") + xlab("Coefficients of the crude model") +
    ylab(bquote("Coefficients of the total 25(OH)D"[3]~"adjusted model")) +
    theme_bw(base_size = 17) + theme(
        panel.grid.major = element_line(color = "gray20", size = 0.3, linetype = "dashed"),
        panel.grid.minor = element_line(color = "gray40", size = 0.3, linetype = "dashed")
    ) + ggtitle(expression(atop(paste("(B) Coefficients of the crude model vs\nthe total 25(OH)", D[3]," adjusted model\n(0h vs 6h)", sep=""))))
我遇到了标题的奇怪行为:
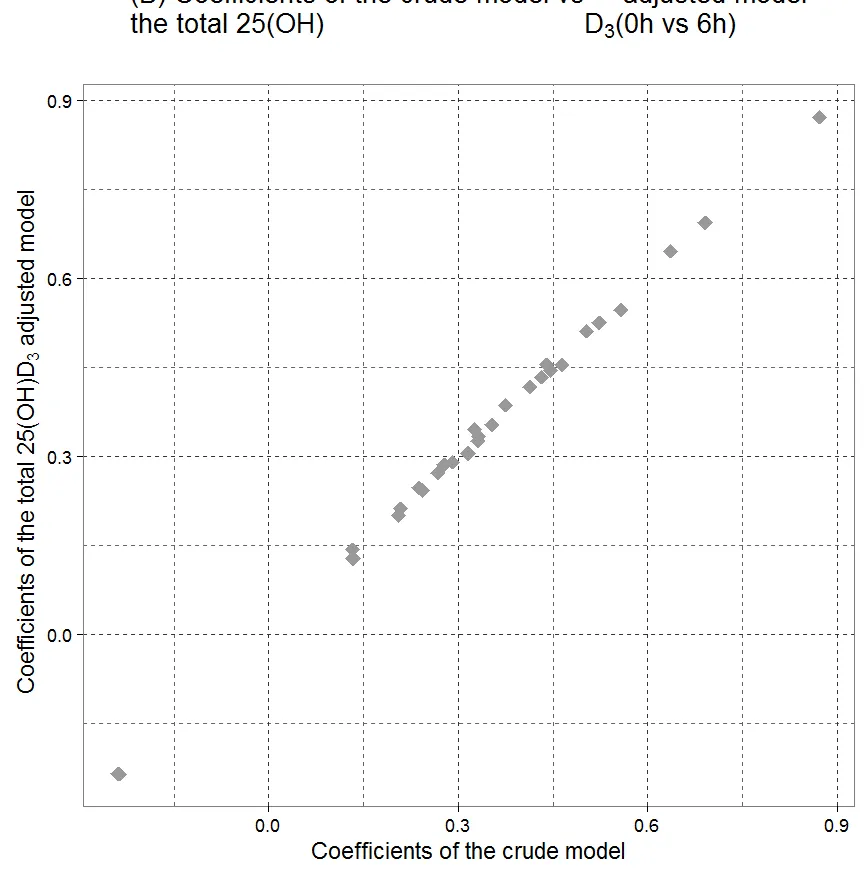
如何通过表达式获得一个三行居中的标题?
更新:
用户Shirin Glander建议更新图形的边距以获得更多标题空间。提供的代码如下:
ggplot(data = fig3, aes(x=crude_beta_time6, y=vidD_beta_time6)) +
geom_point(shape=18, size=5, color="gray60") + xlab("Coefficients of the crude model") +
ylab(bquote("Coefficients of the total 25(OH)D"[3]~"adjusted model")) +
theme_bw(base_size = 17) + theme(
    panel.grid.major = element_line(color = "gray20", size = 0.3, linetype = "dashed"),
    panel.grid.minor = element_line(color = "gray40", size = 0.3, linetype = "dashed")) +
ggtitle(expression(atop(paste("(B) Coefficients of the crude model vs\nthe total 25(OH)", D[3]," adjusted model\n(0h vs 6h)", sep="")))) +
theme(plot.margin=unit(c(4,0,0,0),"cm"))
这段代码的结果为标题添加了更多空间,但是标题没有正确显示: