我想在不使用Xcode测试应用程序的情况下查看iOS模拟器中发生的情况。
例如,如果我在Safari模拟器中打开链接,请查看控制台中发生的情况, 或者如果我安装一个Web应用程序,请在控制台中查看我点击的链接。
我该怎么做呢?
我想在Xcode或终端中查看它,但如果需要使用其他软件也没有问题。
我想在不使用Xcode测试应用程序的情况下查看iOS模拟器中发生的情况。
例如,如果我在Safari模拟器中打开链接,请查看控制台中发生的情况, 或者如果我安装一个Web应用程序,请在控制台中查看我点击的链接。
我该怎么做呢?
我想在Xcode或终端中查看它,但如果需要使用其他软件也没有问题。
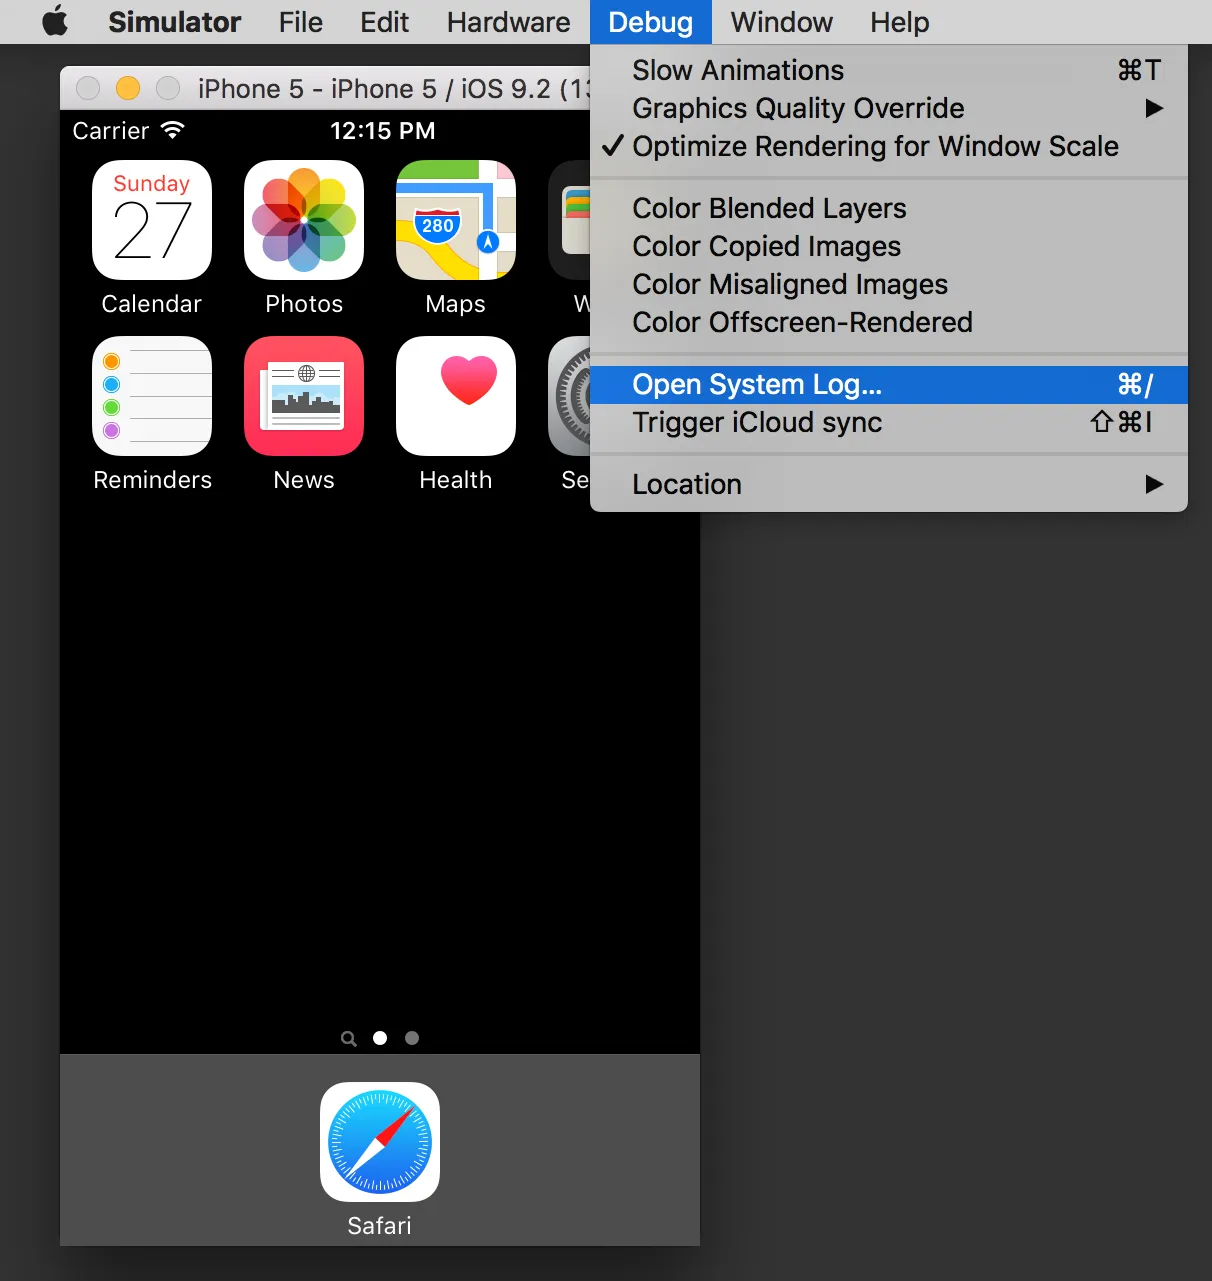
iOS模拟器 > 菜单栏 > 调试 > 打开系统日志
传统方法:
iOS模拟器将其日志直接打印到标准输出(stdout),因此您可以看到与系统日志混在一起的日志。
打开终端并键入:tail -f /var/log/system.log
然后运行模拟器。
编辑:
这在Mavericks/Xcode 5上已经无法使用。现在,您可以在它自己的文件夹中访问模拟器日志:~/Library/Logs/iOS Simulator/<sim-version>/system.log
您可以使用Console.app查看它,或者只需运行tail命令(ios 7.0.3 64位为例):
tail -f ~/Library/Logs/iOS\ Simulator/7.0.3-64/system.log
编辑2:
现在,它们位于~/Library/Logs/CoreSimulator/<simulator-hash>/system.log
tail -f ~/Library/Logs/CoreSimulator/<simulator-hash>/system.log
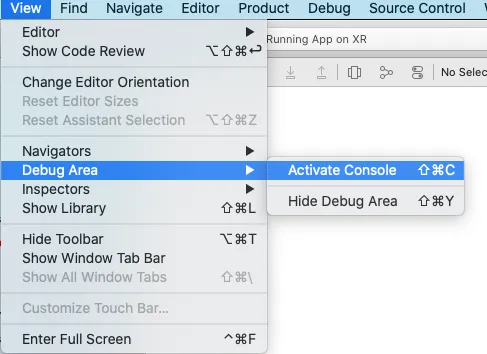
模拟器中有一个选项可以打开控制台
Debug > Open System Log
⌘/
在 iOS 8 和 iOS 9 中,此位置现在为:
~/Library/Logs/CoreSimulator/<DEVICE_CODE>
所以,以下内容将有效:
tail -f ~/Library/Logs/CoreSimulator/<DEVICE_CODE>/system.log
DEVICE_CODE的值可以通过以下终端命令找到:
instruments -s devices
instruments -s devices。 - viteinfinitexcrun simctl spawn booted log stream --level=debug | grep App_Debug_String 可以使用。 - rustyMagnetinstruments 命令。instruments 位于哪里? - Martin Braun不应依赖于 instruments -s。官方支持的从命令行操作模拟器的工具是 xcrun simctl。
设备的日志目录可以通过 xcrun simctl getenv booted SIMULATOR_LOG_ROOT 找到。即使位置发生更改,这也将始终是正确的。
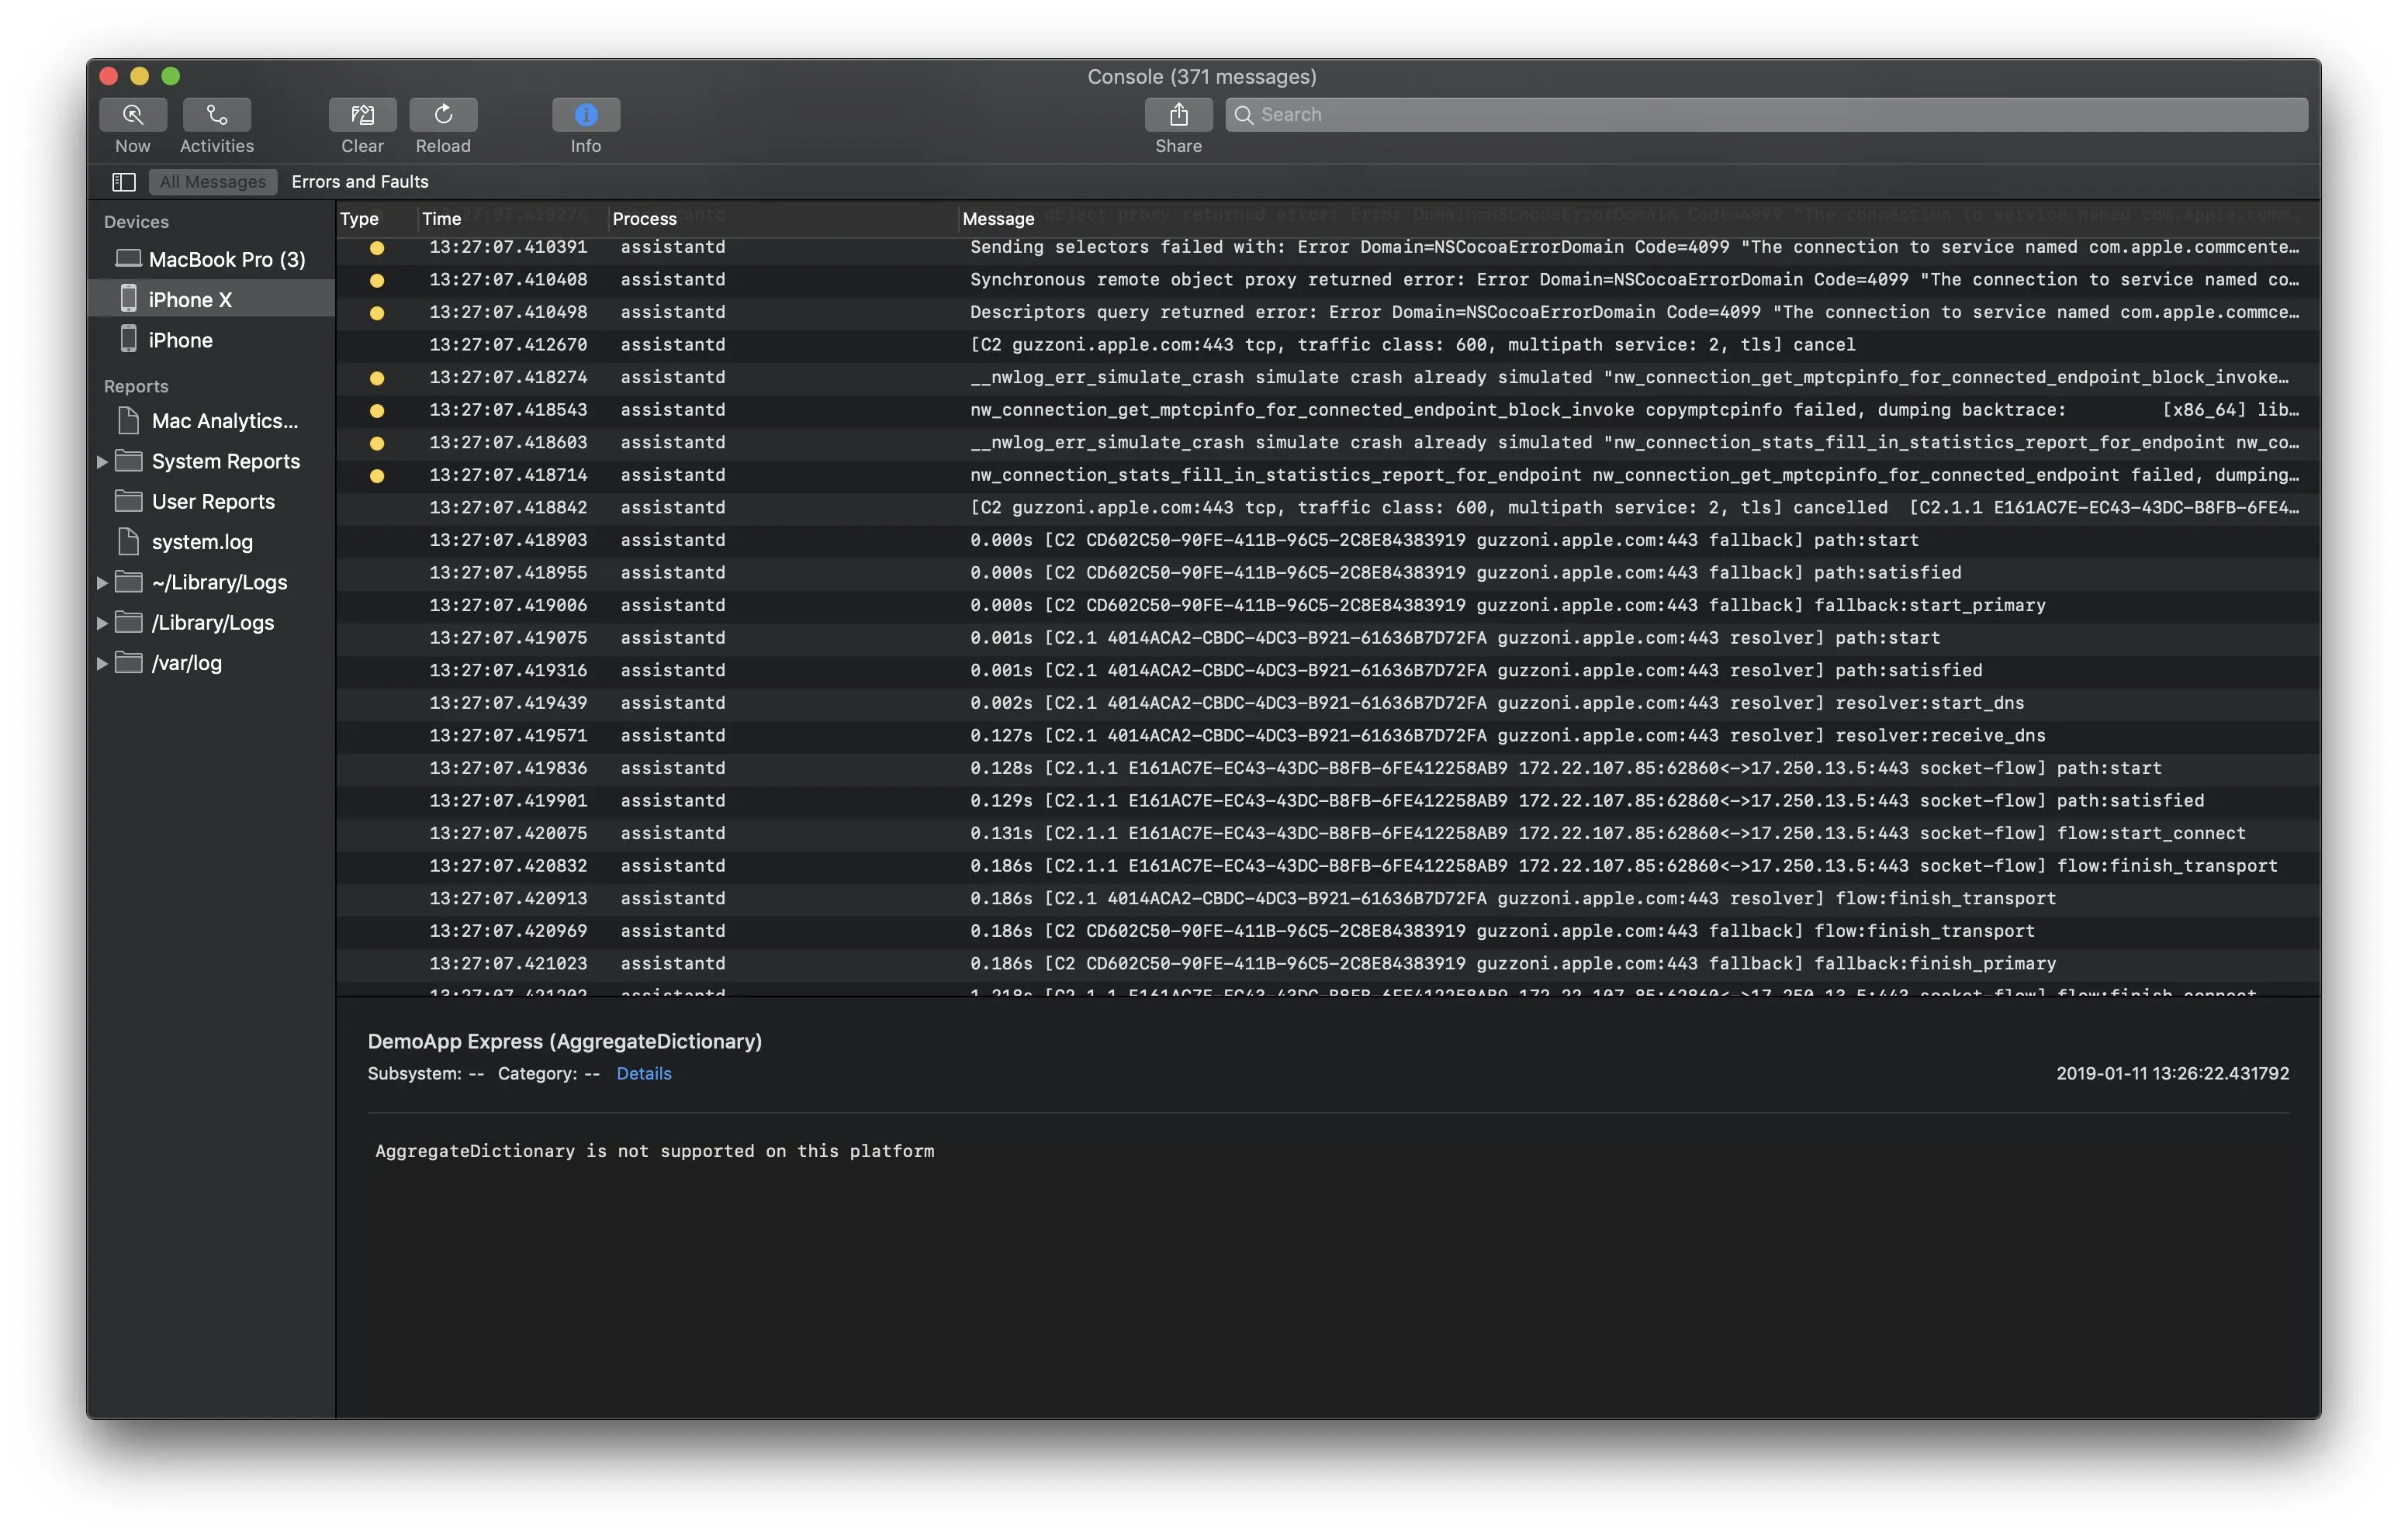
现在随着事物转移到 os_log,在主机 Mac 上打开 Console.app 更加容易。启动的模拟器应该显示为左侧的日志来源,就像实体设备一样。您也可以在启动的模拟器中运行日志命令:
# os_log equivalent of tail -f
xcrun simctl spawn booted log stream --level=debug

# filter log output
xcrun simctl spawn booted log stream --predicate 'processImagePath endswith "myapp"'
xcrun simctl spawn booted log stream --predicate 'eventMessage contains "error" and messageType == info'

# a log dump that Console.app can open
xcrun simctl spawn booted log collect

# open location where log collect will write the dump
cd `xcrun simctl getenv booted SIMULATOR_SHARED_RESOURCES_DIRECTORY`
如果您想在模拟器中使用Safari开发人员工具(包括JS控制台):启动其中一个模拟器,打开Safari,然后在您的Mac上进入Safari菜单,您应该看到模拟器。
您可以通过从Safari地址栏拖动并将其放在模拟器窗口上来在模拟器中打开URL。 您也可以使用xcrun simctl openurl booted <url>。
xcrun simctl spawn booted log collect命令输出的结果是:成功将归档写入到/Users/<user>/Library/Logs/CoreSimulator/<simulator_guid>/system_logs.logarchive,这样我就可以打开结果了。而xcrun simctl getenv booted SIMULATOR_SHARED_RESOURCES_DIRECTORY命令的输出是/Users/<user>/Library/Developer/CoreSimulator/Devices/<simulator_guid>/data。花了几分钟困惑,因为我找不到日志文件,原来是我在错误的目录下。 - undefined苹果日志
您可以使用Mac上的Console应用程序(在设备中选择您的设备)来查看使用NSLog、os_log、Logger发送的日志消息(您将无法看到print函数的日志)。
另外,请检查(操作 -> 包括<信息/调试>消息)
WebView(UIWebView或WKWebView)的日志,您应该使用Safari Web Inspector。Device
- Settings -> Safari -> Advanced -> <check in> Web Inspector
Mac
- Safari -> Settings -> Advanced -> <check in> Show Develop menu in menu bar
- Develop -> <device>
cmd 键,然后按下空格键。输入 "控制台",再按下回车键。顺便说一句,这应该是今天的正确答案。 - user3025289println仅会打印到调试日志(显示在xCode的调试区域中)。如果您想要打印到system.log,则必须像以前一样使用NSLog。接着,您可以通过菜单Debug > Open System Log... (cmd + /)查看模拟器日志。tailing命令/var/log/system.log对我来说不起作用。我通过使用Console.app找到了我的日志。它们位于
~/Library/Logs/iOS Simulator/{version}/system.log
XCode > 6.0 AND iOS > 8.0
如果您的XCode版本大于8.0,则下面的脚本可以正常运行。
我使用下面的小脚本将模拟器日志输出到系统控制台。
#!/bin/sh
sim_dir=`xcrun instruments -s | grep "iPhone 6 (8.2 Simulator)" | awk {'print $NF'} | tr -d '[]'`
tail -f ~/Library/Logs/CoreSimulator/$sim_dir/system.log
您可以将Grep中使用的模拟器类型作为参数传递。如上所述,根据Xcode版本,有simctl和instruments命令可用于查看可用于使用的模拟器类型列表。
要查看可用设备/模拟器的列表,请执行以下操作:
xcrun instruments -s
或者
xcrun simctl list