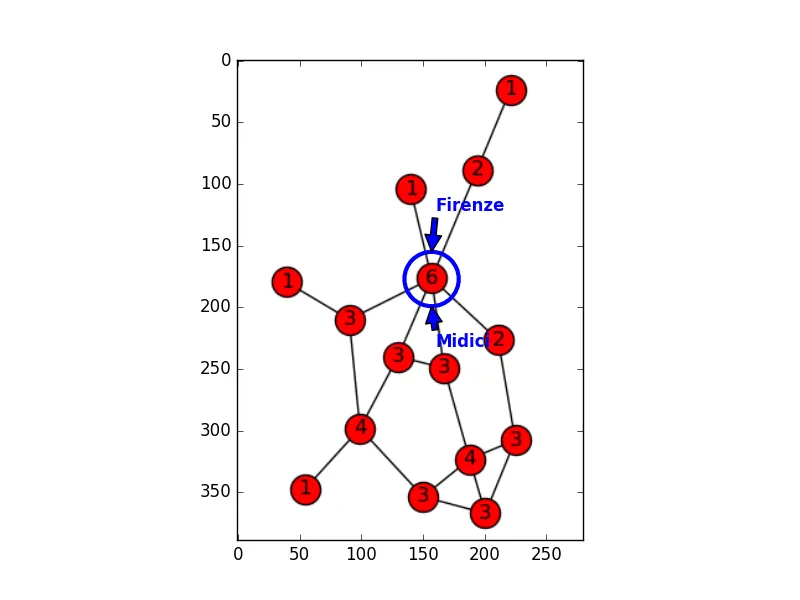
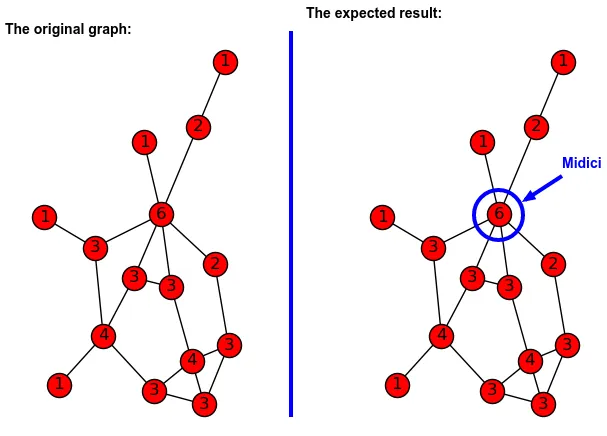
我使用matplotlib绘制了由networkx创建的图表。现在,我想在特定节点周围添加注释和圆形。例如,
我使用以下代码与 plt.annotate(*args, **kwargs) 一起使用:
# add annotate text
pos = nx.get_node_attributes(G, 'pos')
pos_annotation_node = pos['Medici']
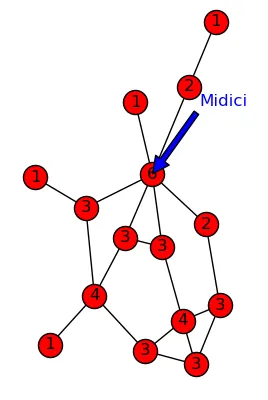
ax2.annotate('Midici',
xy=pos_annotation_node,
xytext=(i+0.2 for i in pos_annotation_node),
color='blue',
arrowprops=dict(facecolor='blue', shrink=0.01)
)
我得到了这张丑陋的图表,
我有两个问题:
- 如何像第一张图中所示,在节点
6周围画一个圆。 - 为了得到一个好看的图形,我需要手动设置
xytext的值很多次。有更好的方法吗?