当尝试使用Seaborns的sns.heatmap函数绘制热图时,如果使用FormatStrFormatter格式化x轴,则会出现错误的刻度。 在构建所需的pivot数据框架之后,相关代码如下:
ax = sns.heatmap(oi_pivot_df, cmap=plt.cm.Spectral, cbar=True)
ax.xaxis.set_major_formatter(ticker.FormatStrFormatter('%.2f'))
ax.invert_yaxis()
ax.set_xlabel('moneyness')
ax.set_ylabel('time to maturity (years)')

fig = plt.gcf()
plt.tight_layout()
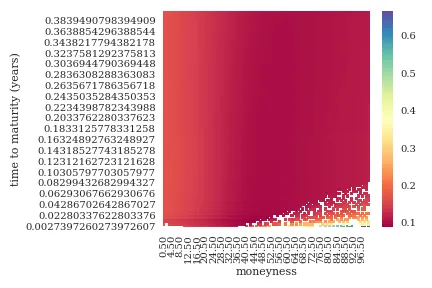
在这里,x的取值范围为0.5到96.5。如果没有格式化程序,则x轴刻度线是实际范围:
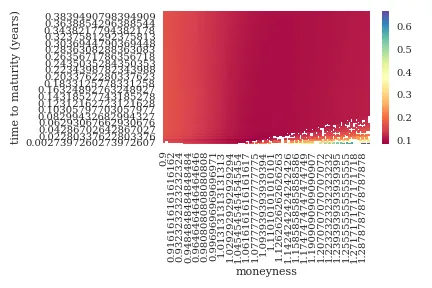
我应该如何更改格式化程序,以便返回格式化后的x轴刻度线,只显示前两位小数,例如在我的下面示例中,x轴应该从0.92到1.29。
.StrMethodFormatter(fmt)是否能得到类似的结果? - wwiiticker.StrMethodFormatter("{x:.2f}")会得到相同(错误)的结果。 - Ben