Flot中的x轴标签

4

我想做的就是给我的x轴打标签:

function doPlot(position) {//Flot
  $.plot("#placeholder", [//data
    {
      data: theta_plot,
      label: "Angle (rad)",
      yaxis: 1,
      color: "red"
    },
    {
      data: omega_plot,
      label: "Angular Velocity (rad/sec)",
      yaxis: 2,
      color: "green"
    },
    {
      data: e_plot,
      label: "Energy (J)",
      yaxis: 3,
      color: "blue"
    }
  ],//options
    {
      xaxis: {
        axisLabel: "Time (sec)",
        axisLabelUseCanvas: true
      },
      yaxes: [
        { font: { color: "red" } },
        { font: { color: "green" } },
        { font: { color: "blue" } },
        { alignTicksWithAxis: position === "left" ? 1 : null }
      ],
      legend: {
        position: "nw",
        labelBoxBorderColor: null
      }
    }
    );
}
doPlot("left");

我不明白为什么这不起作用。这应该是一个易于理解的问题。我能提供的唯一解决方案是两年前的这个。现在我还需要
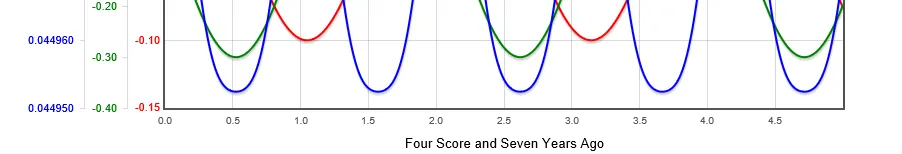
jquery.flot.axislabels.js库吗?
这里是问题图表的最新草稿. 有什么想法?
2个回答

5

现在我是否仍需要jquery.flot.axislabels.js库?

是的。

没有插件,标准Flot没有轴标签功能。就这么简单。


支持已经存在于开发0.9版本中:http://www.flotcharts.org/blog/2013/06/27/planning-for-09/. - Mark
下一个问题是: 那个版本还要多久才能开发完成?^^ - Raidri
这是一个非常好的问题,看起来似乎已经停滞了,最后一次提交是在五月份。 - Mark

4
如果您不想使用插件,可以在绘图后添加标签。您可以使用一些 jQuery 来实现:
// create label div
var label = $('<div>Four Score and Seven Years Ago</div>'); 
// intial positioning
label.css({'position': 'absolute', 'left': $('.flot-x-axis').width()/2 + $('.flot-x-axis .tickLabel:first').position()['left']/2, 'top': $('.flot-x-axis').height() + 5});
// append to plot
$('#placeholder').append(label); 
// final position adjustment (label won't have width till appended)
label.css('left', label.position()['left'] - label.width() / 2);

在您的图表中,结果如下所示:

enter image description here


网页内容由stack overflow 提供, 点击上面的
可以查看英文原文,
原文链接