我正在使用pyqtgraph,并希望为散点图添加图例项。
我已经修改了示例代码,如下所示:
我得到的结果是: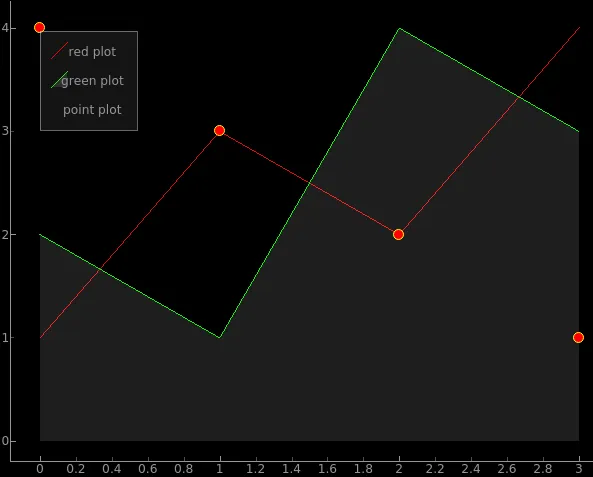 如何添加适当的图例项?
我已经修改了示例代码,如下所示:
# -*- coding: utf-8 -*-
"""
Demonstrates basic use of LegendItem

"""
import initExample ## Add path to library (just for examples; you do not need this)

import pyqtgraph as pg
from pyqtgraph.Qt import QtCore, QtGui

plt = pg.plot()
plt.setWindowTitle('pyqtgraph example: Legend')
plt.addLegend()

c1 = plt.plot([1,3,2,4], pen='r', name='red plot')
c2 = plt.plot([2,1,4,3], pen='g', fillLevel=0, fillBrush=(255,255,255,30), name='green plot')
c3 = plt.plot([4,3,2,1], pen=None, symbol='o', symbolPen='y', symbolBrush='r', name="point plot")


## Start Qt event loop unless running in interactive mode or using pyside.
if __name__ == '__main__':
    import sys
    if (sys.flags.interactive != 1) or not hasattr(QtCore, 'PYQT_VERSION'):
        QtGui.QApplication.instance().exec_()
我得到的结果是:
如何添加适当的图例项?