使用纯SVG在水平条形图中添加内联标签

3
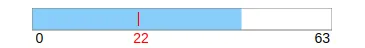
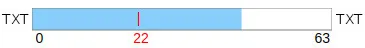
我使用以下SVG代码构建了一个水平条形图表,它很好,但我还需要在图表之前和之后添加两个内联标签。我知道如何使用HTML和CSS添加它们,但我只想使用纯SVG来解决这个问题。如何实现?

  <svg class="chart" width="300px" height="40">
        <g transform="translate(0,0)">
            <rect width="82%" height="22" fill="lightskyblue"></rect>
            <rect width="100%" height="22" style="fill:none; stroke-width:1; stroke:gray;"></rect>
            <text y="30" dx="0.25em" dy=".35em">0</text>
            <text x="20%" y="10" dy=".35em" fill="red">|</text>
            <text x="20%" y="30" dx="-0.25em" dy=".35em" fill="red">13</text>
            <text x="100%" y="30" dx="-1.25em" dy=".35em">63</text>
        </g>
    </svg>

这是我现在拥有的内容:

enter image description here

这是我想要的内容:

enter image description here

1个回答

2
为了使其正常工作,我将您的代码嵌套在一个较大的svg元素中。请注意,我使用了viewBox属性,其中x分量具有负值(-50),为文本留出空间。

svg{border:solid;}
<svg class="chart" width="300px" viewBox="-50 0 400 40">
  <text y="20" x="-45">TXT</text>
  <text x="345" y="20" text-anchor="end">TXT</text>
    <svg viewBox="0 0 300 40" width="300">
        <rect width="82%" height="22" fill="lightskyblue"></rect>
        <rect width="100%" height="22" style="fill:none; stroke-width:1; stroke:gray;"></rect>
        <text y="30" dx="0.25em" dy=".35em">0</text>
        <text x="20%" y="10" dy=".35em" fill="red">|</text>
        <text x="20%" y="30" dx="-0.25em" dy=".35em" fill="red">13</text>
        <text x="100%" y="30" dx="-1.25em" dy=".35em">63</text>
  </svg>
 </svg>

我必须告诉你,我不会为矩形的位置和大小使用百分比。我会使用用户单位(没有单位标识符)来完成它,并且不需要将其包装在另一个SVG元素中。

更新

原帖作者在评论中说:

你能给出另一个例子吗?不使用矩形的位置和大小的百分比,并且不需要将其包装在另一个SVG元素中。

svg{border:solid}
<svg class="chart" width="300px" viewBox="-50 0 400 40">
  <text y="20" x="-45">TXT</text>
  <text x="345" y="20" text-anchor="end">TXT</text>
    
        <rect width="246" height="22" fill="lightskyblue"></rect>
        <rect width="300" height="22" style="fill:none; stroke-width:1; stroke:gray;"></rect>
        <text y="30" dx="0.25em" dy=".35em">0</text>
        <text x="60" y="10" dy=".35em" fill="red">|</text>
        <text x="60" y="30" dx="-0.25em" dy=".35em" fill="red">13</text>
        <text x="300" y="30" dx="-1.25em" dy=".35em">63</text>
  <svg>


谢谢!你能再举一个例子吗?这次不要用百分比来指定矩形的位置和大小,也不要将其包装在另一个SVG元素中。 - Yurié
非常感谢! - Yurié

网页内容由stack overflow 提供, 点击上面的
可以查看英文原文,
原文链接