我很难在不同的图形中保持相同的颜色条范围。
例如,我有以下可视化效果:
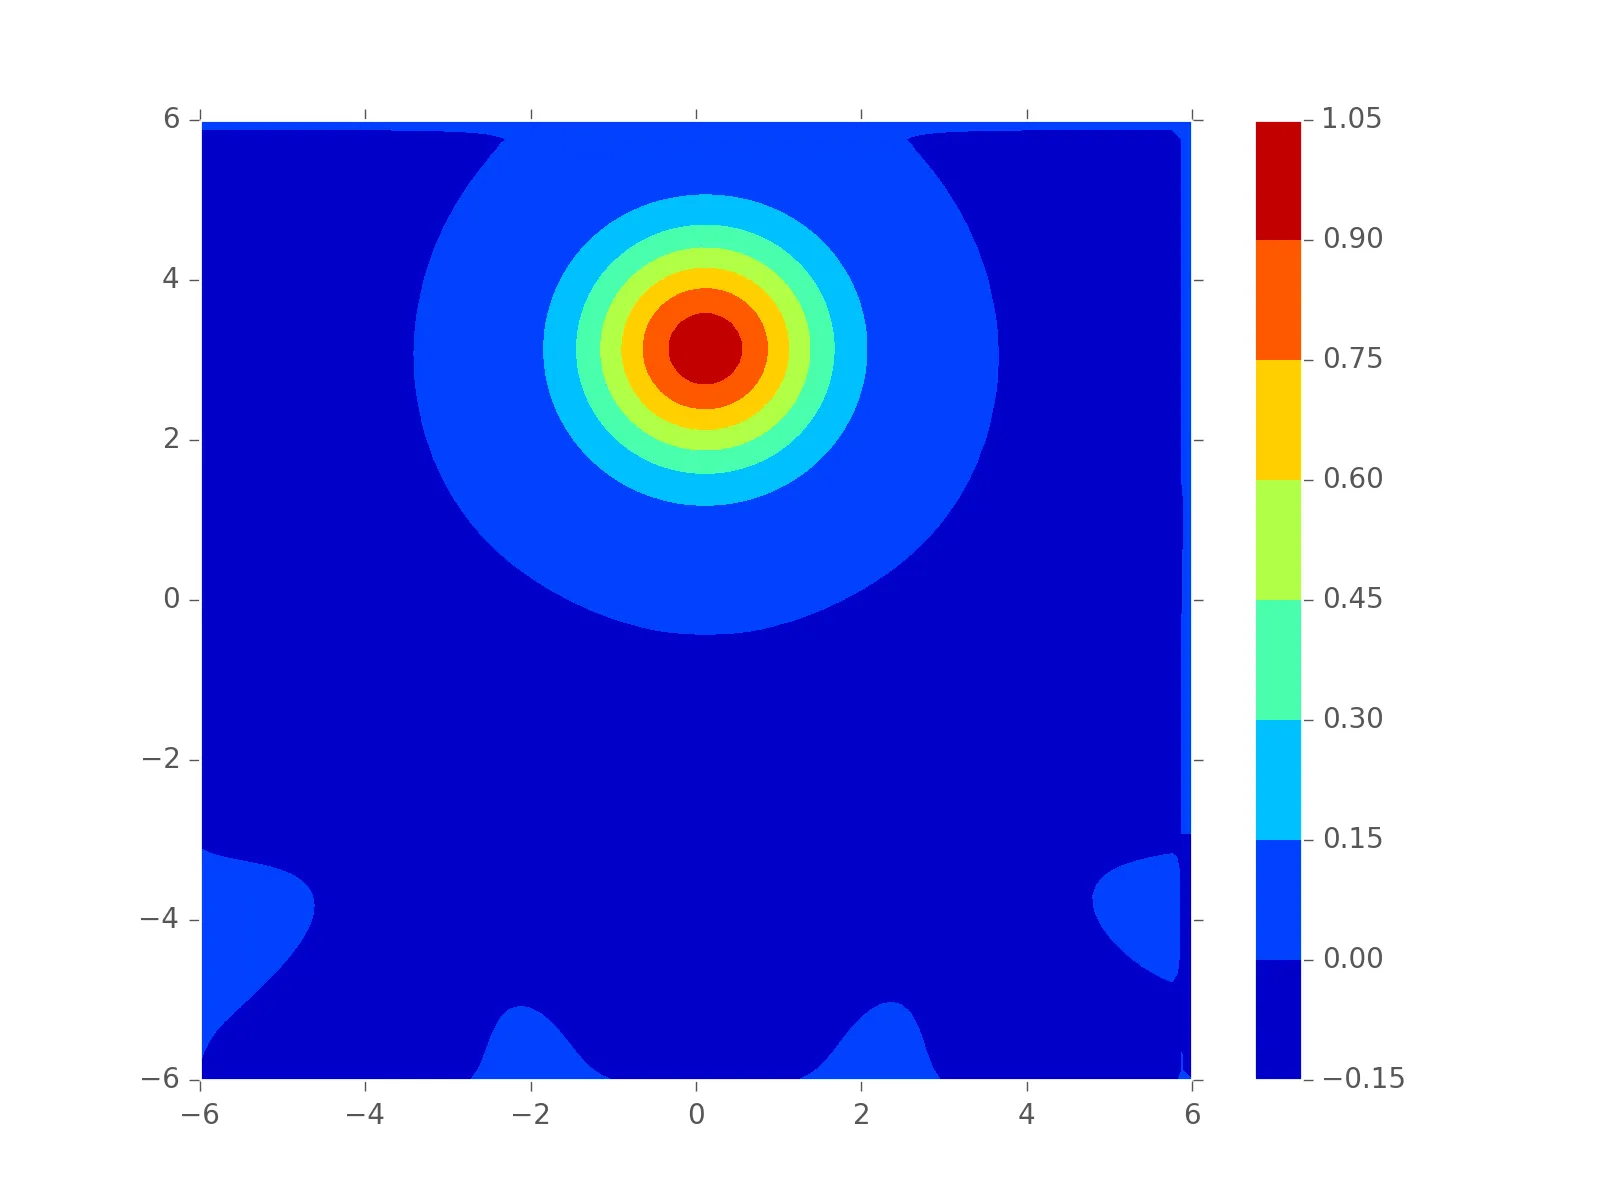
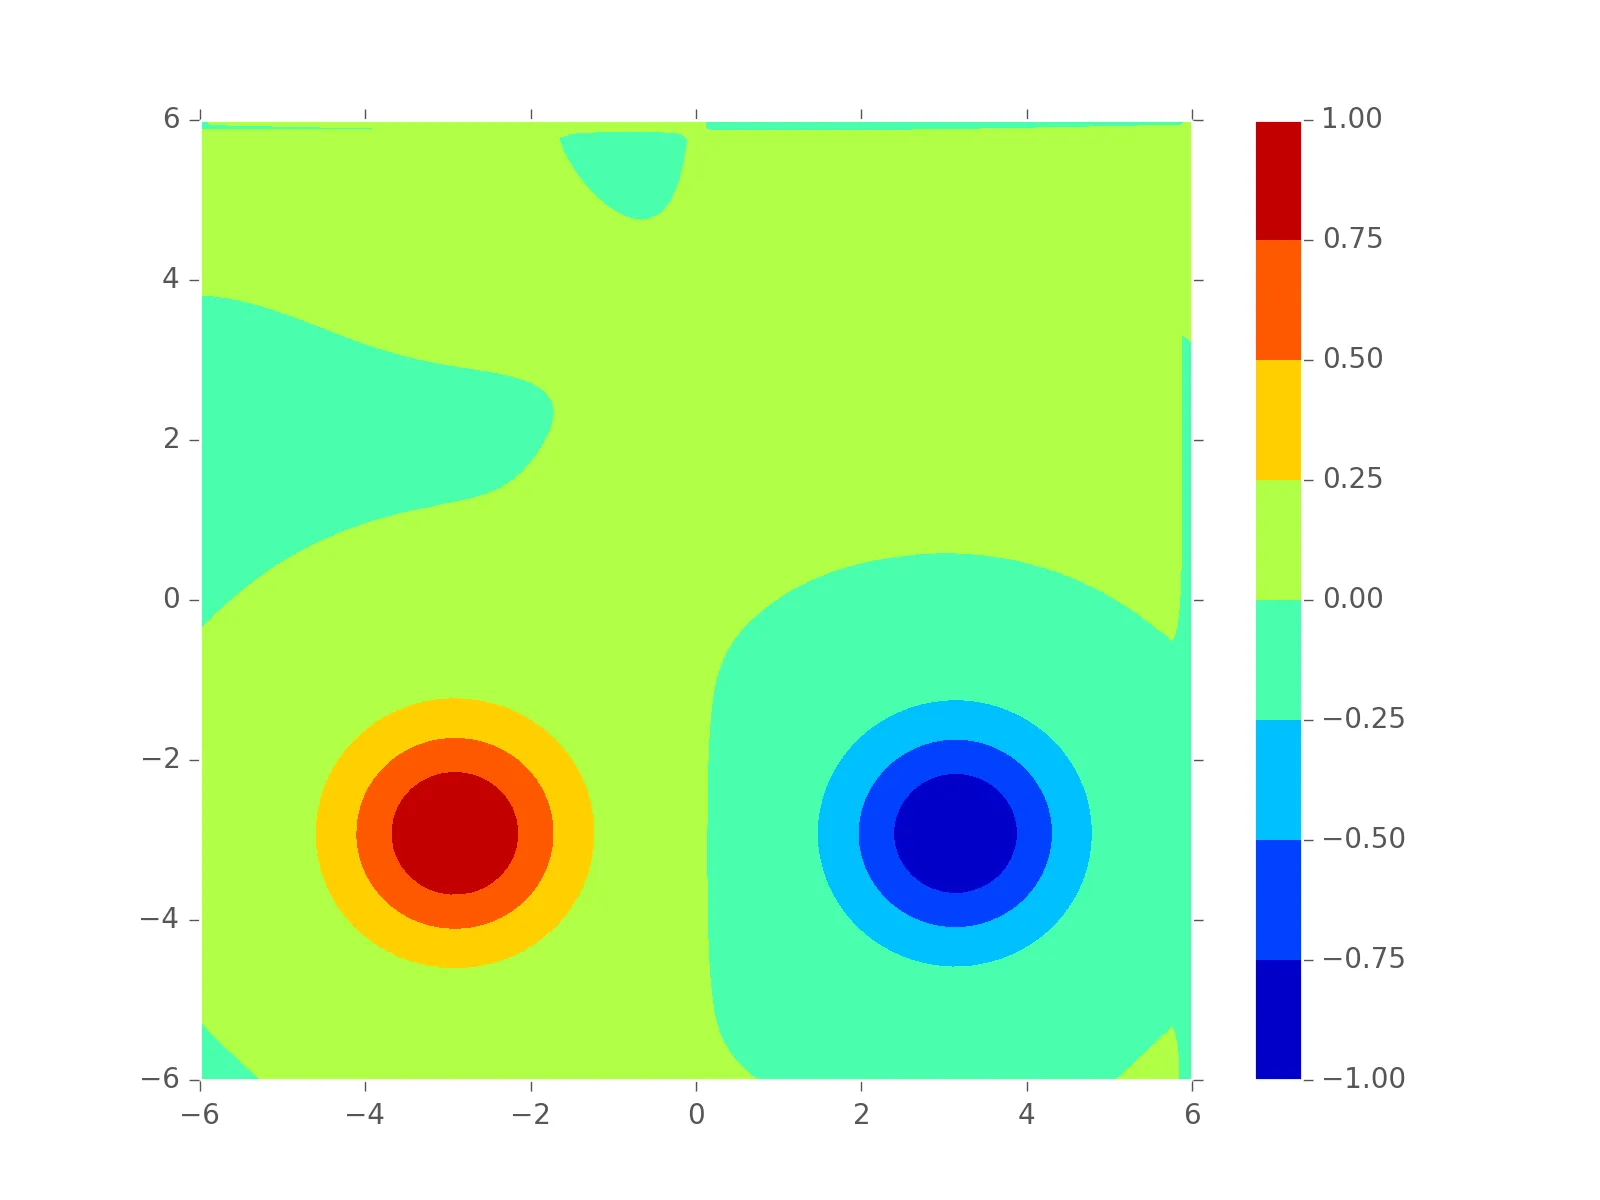
这些是使用以下代码生成的:
def plot_contour(x_dim, y_dim, x_steps, y_steps, scalar_field, file_path):
    plt.figure()

    x, y = numpy.mgrid[-x_dim:x_dim/:x_steps*1j, -y_dim:y_dim:y_steps*1j]
    cs = plt.contourf(x, y, scalar_field, zorder=1, extent=[-x_dim, x_dim, -y_dim, y_dim])
    plt.colorbar(cs)

    plt.savefig(file_path + '.png', dpi=Vc.dpi)
    plt.close()
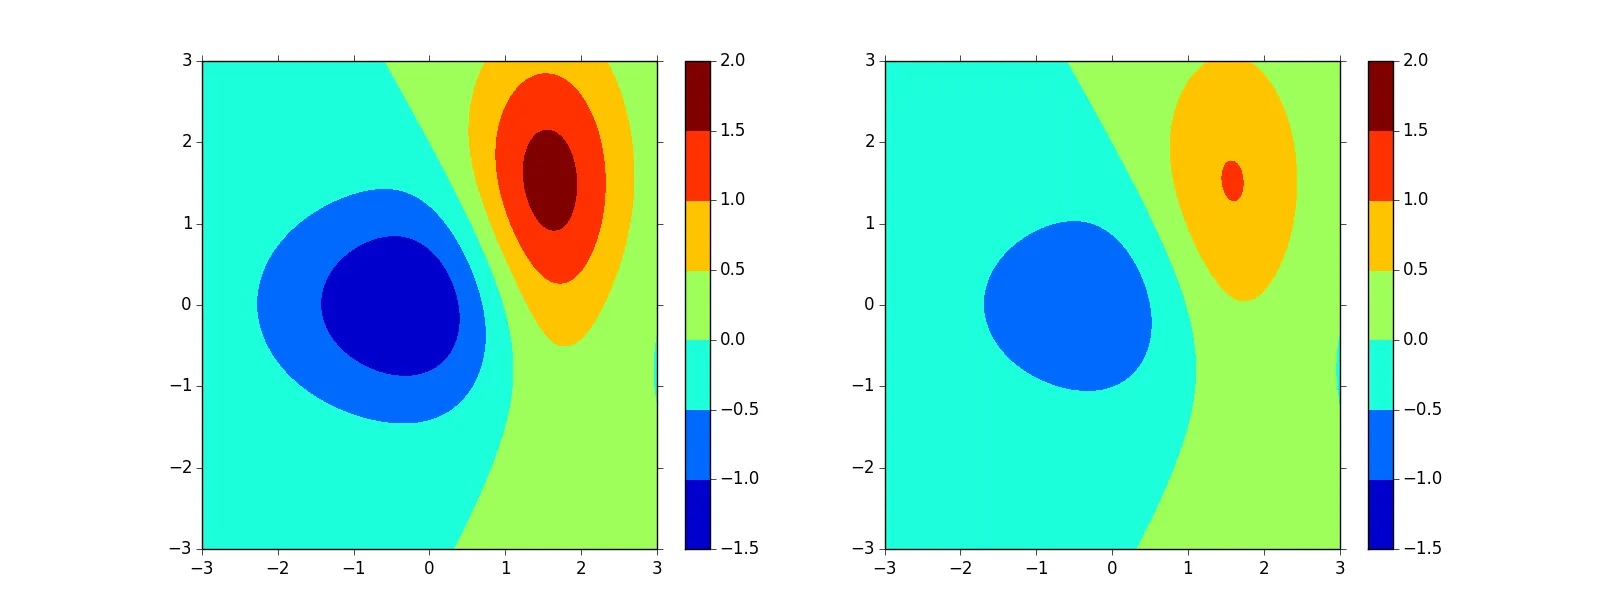
我希望能够比较这两个字段,因此,我想要为它们使用相同的颜色映射。
我的第一种方法是使用参数
v_min和v_max,使用数据的最小/最大值。cs = plt.contourf(x, y, scalar_field, zorder=1, extent=[-x_dim, x_dim, -y_dim, y_dim], vmin=-1.00, vmax=1.05) # Manual setting to test
接着我得到了相同的颜色映射:
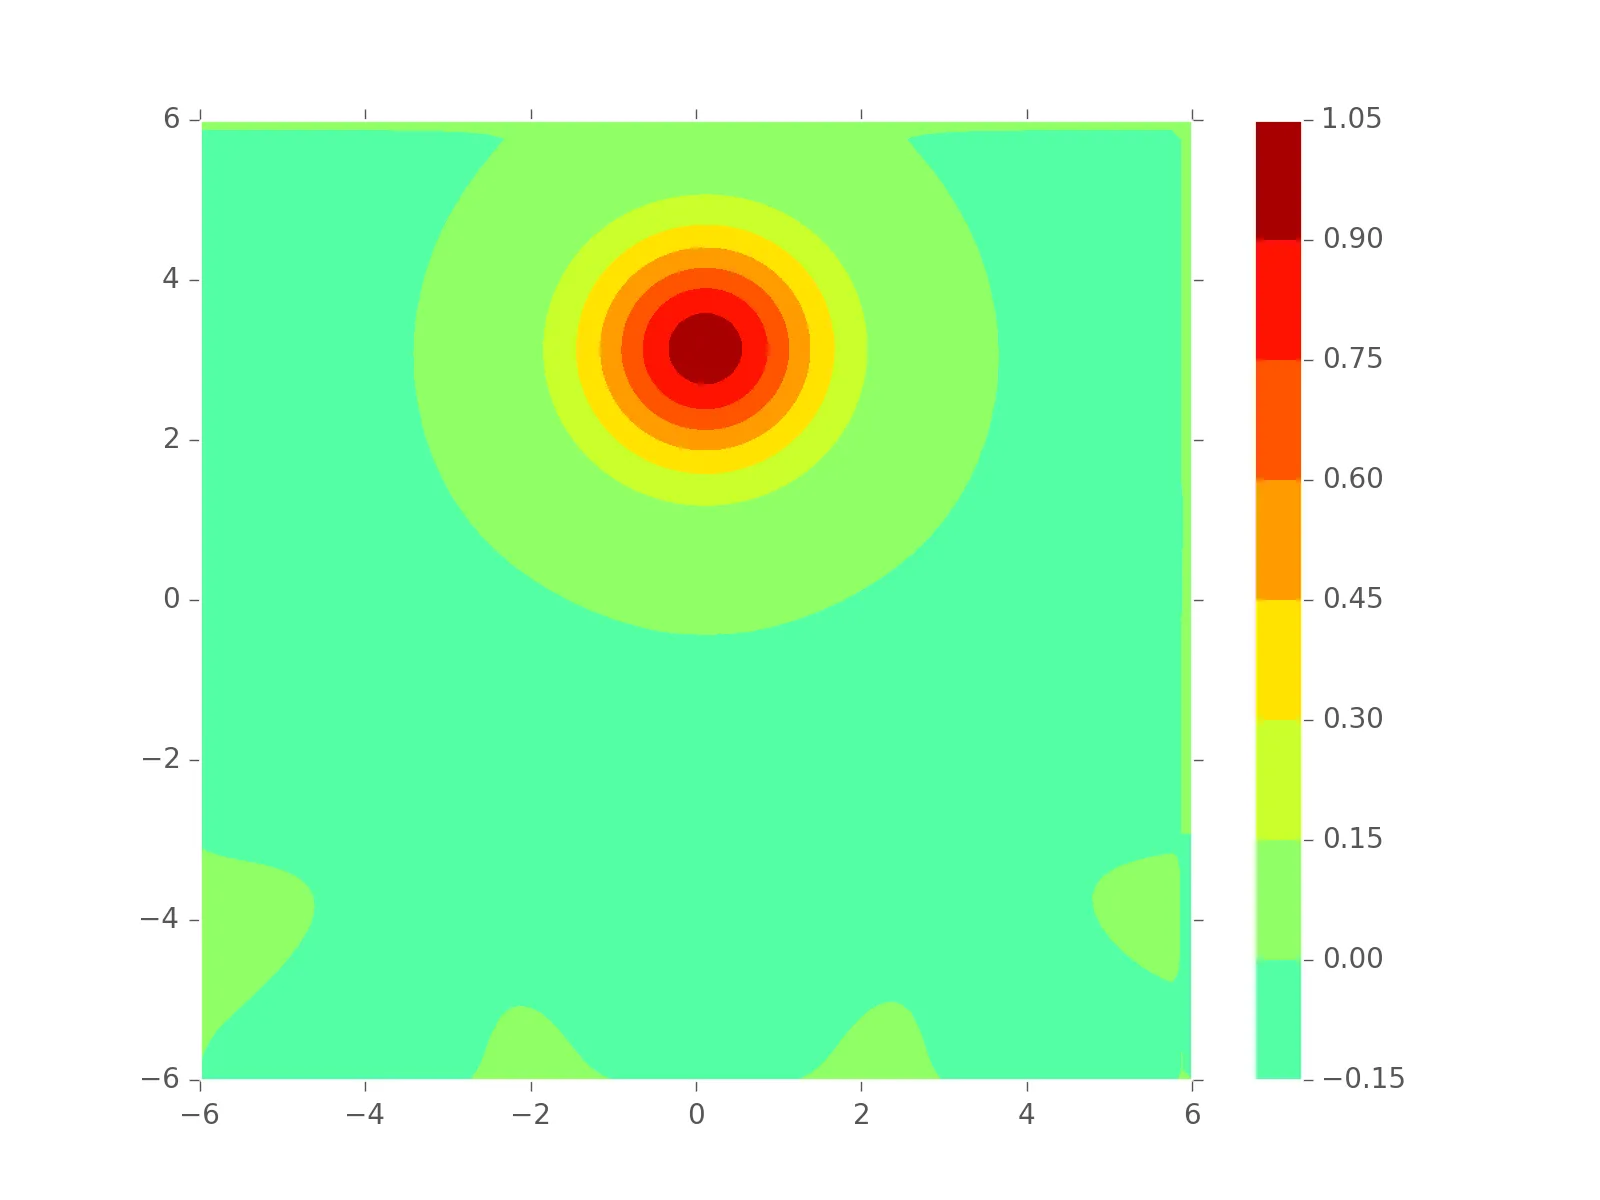
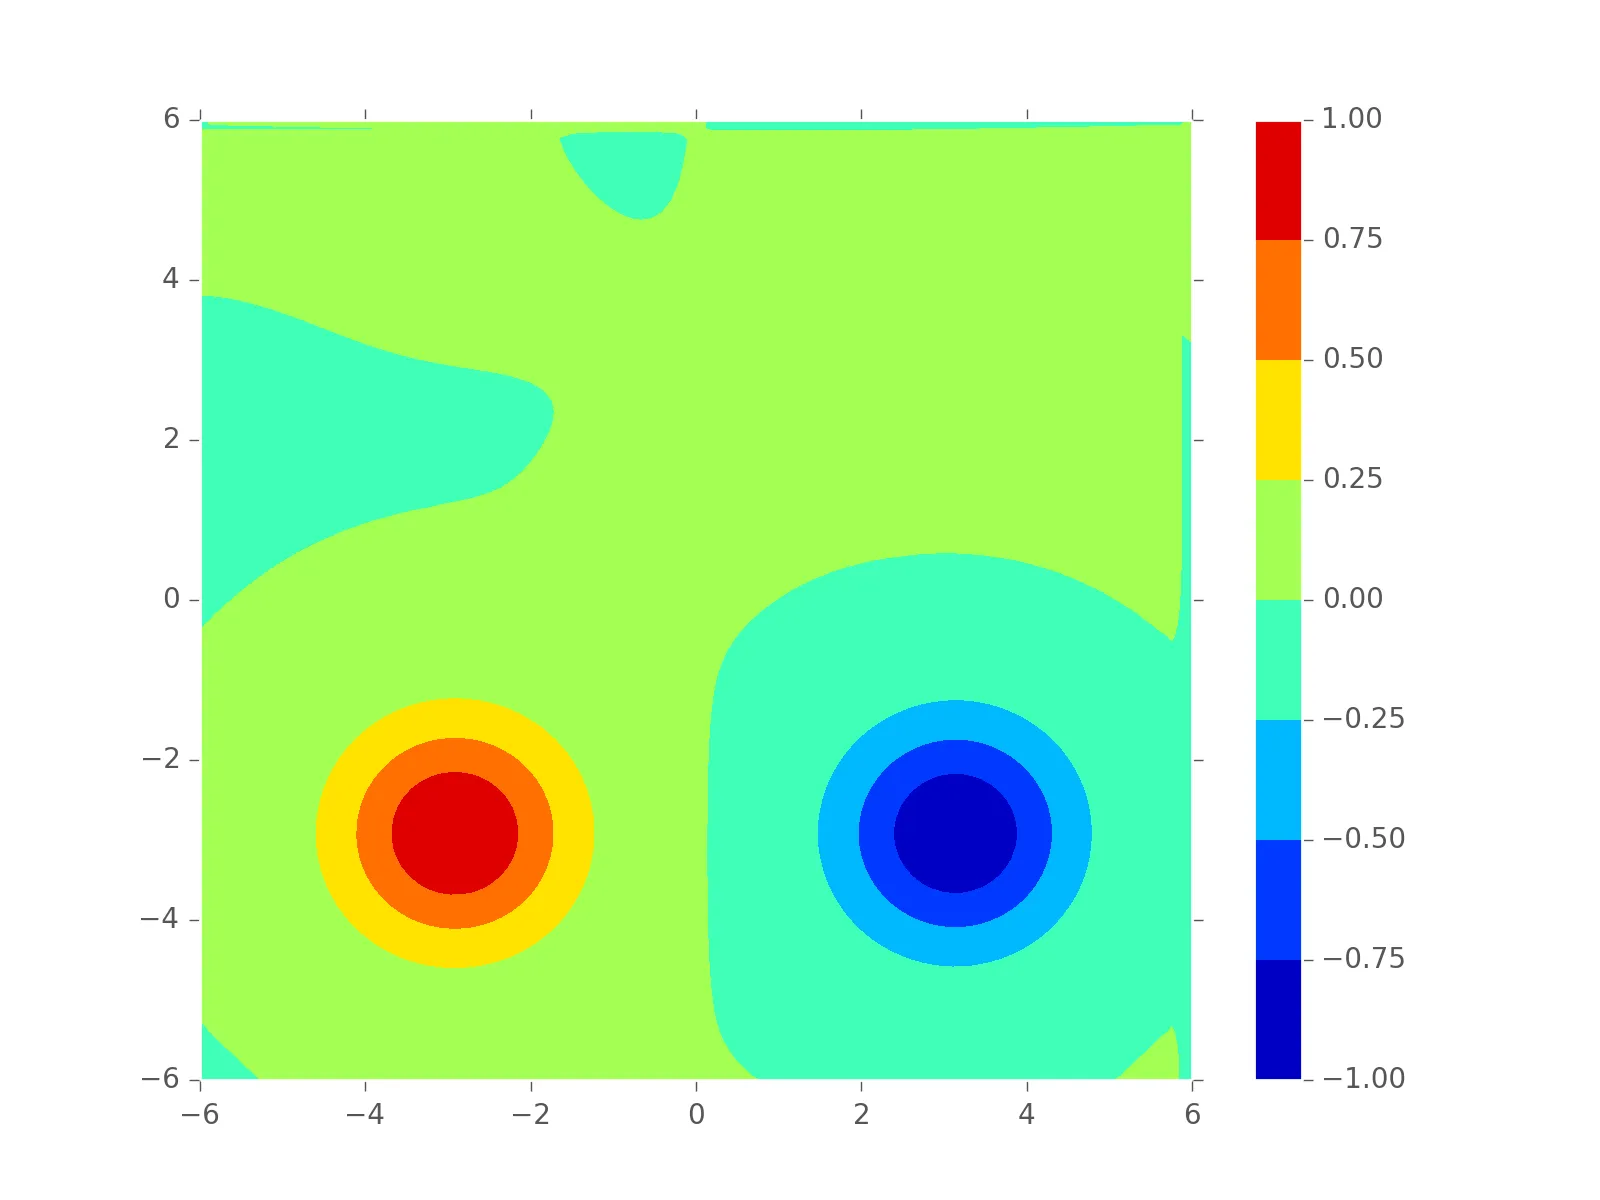
但是我也想在图表中显示相同的颜色条范围。我尝试使用
cb = plt.colorbar(cs)
cb.set_clim(vmin=-1.00, vmax=1.05)
没有成功。
这个完整的示例会产生同样的行为:
import matplotlib
import numpy as numpy
import matplotlib.cm as cm
import matplotlib.mlab as mlab
import matplotlib.pyplot as plt

matplotlib.rcParams['xtick.direction'] = 'out'
matplotlib.rcParams['ytick.direction'] = 'out'

delta = 0.025
x = numpy.arange(-3.0, 3.0, delta)
y = numpy.arange(-2.0, 2.0, delta)
X, Y = numpy.meshgrid(x, y)

Z1 = mlab.bivariate_normal(X, Y, 1.0, 1.0, 0.0, 0.0)
Z2 = mlab.bivariate_normal(X, Y, 1.5, 0.5, 1, 1)
# difference of Gaussians

Za = 10.0 * (Z2 - Z1)
Zb = 5.0 * (Z2 - Z1)

def bounds(scalar_fields):
    """
    Get the bounds of a set of scalar_fields
    :param scalar_fields : the scalar field set
    :return: a set of normalized vector field components
    """
    max_bound = -numpy.inf
    min_bound = numpy.inf

    for scalar_field in scalar_fields:
        max_lim = numpy.max(scalar_field)
        min_lim = numpy.min(scalar_field)
        if max_lim > max_bound:
            max_bound = max_lim
        if min_lim < min_bound:
            min_bound = min_lim

    return min_bound, max_bound

def plot_contour(x_dim, y_dim, x_steps, y_steps, scalar_field, v_min, v_max, file_path):
    plt.figure()

    x, y = numpy.mgrid[-x_dim/2:x_dim/2:x_steps*1j, -y_dim/2:y_dim/2:y_steps*1j]

    cs = plt.contourf(x, y, scalar_field, zorder=1, extent=[-x_dim/2.0, x_dim/2.0, -y_dim/2.0, y_dim/2.0],
                      vmin=v_min, vmax=v_max)
    cb = plt.colorbar(cs)

    plt.savefig(file_path + '.png')
    plt.close()

v_min, v_max = bounds([Za, Zb])
x_dim = y_dim = 6

y_steps = x.shape[0]
x_steps = y.shape[0]

plot_contour(x_dim, y_dim, x_steps, y_steps, Za, v_min, v_max, 'Za')
plot_contour(x_dim, y_dim, x_steps, y_steps, Zb, v_min, v_max, 'Zb')
我该怎么做呢?
提前感谢你的帮助。
vmin和vmax?你正在做的应该可以工作。你能否在完整的可调用示例中重现此操作(包括合成数据)? - tacaswellset_clim应该放在cs对象上,而不是 colorbar 上。 - tacaswell