使用GDAL在Python和Matplotlib中读取TIFF文件

4

我将尝试使用Python和MatPlotLib显示灰度TIFF文件。

到目前为止,我已经读取了以下代码:

import scipy as N
import gdal
import sys
import matplotlib.pyplot as pyplot

try:
    tif = gdal.Open('filename.tif')
    tifArray = tif.ReadAsArray()
except:
    print 'The file does not exist.'
    sys.exit(0)

band1 = tif.GetRasterBand(1)
band2 = tif.GetRasterBand(2)
band3 = tif.GetRasterBand(3)

band1Array = band1.ReadAsArray()
band2Array = band2.ReadAsArray()
band3Array = band3.ReadAsArray()

但是我不知道我还应该做什么... 我很无助。有人能帮帮我吗?

你为什么没有收到任何有关GDAL的导入错误? - Tush_08
1个回答

11

如果你已经将文件处理成一个二维数组,你可以使用matplotlib中任何绘制二维数组的函数,例如cmap、imshow等。

下面是使用大理石示例的输出结果

import matplotlib.image as mpimg
import matplotlib.pyplot as plt

img=mpimg.imread('MARBLES.TIF ')
imgplot = plt.imshow(img)

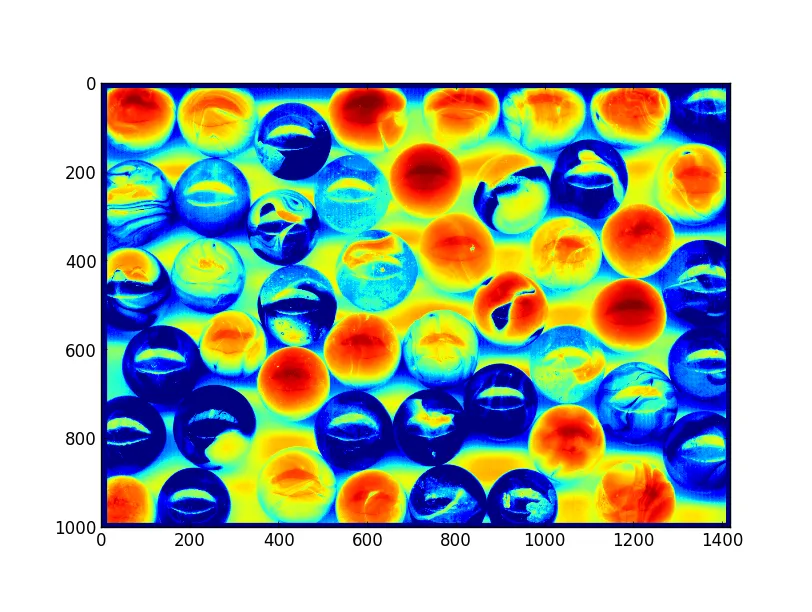
如果您只查看图像的第三条带,您将得到以下内容:

imgplot2 = plt.imshow(band3Array)
plt.show()

marbles的第三波段

深入了解MPL中的图像查看和2D数组函数...


网页内容由stack overflow 提供, 点击上面的
可以查看英文原文,
原文链接