R Shiny:在plotOutput中创建非响应式背景

3

我正在尝试构建一个闪亮的应用程序,可以通过交互方式更改绘图。 我希望该图在毫秒级别内更改,并且由于更改仅涉及添加一些点,因此这实际上是可能的。

可重现的示例包含了这个想法的抽象。第一个示例绘制了一个散点图,我可以交互式地更改点的数量。 这基本上立即发生。 我将把这部分图称为"反应层"。

library(shiny)

ui <- fluidPage(
  
  sliderInput(inputId = "slider_input", label = "Reactive values:", min = 1, max = 100, value = 10),
  plotOutput(outputId = "plotx")
  
)

quick_server <- function(input, output, session){
    
  output$plotx <- renderPlot({
    
    # reactive layer
    plot(
      x = sample(x = -4:4, size = input$slider_input, replace = T), 
      y = sample(x = -4:4, size = input$slider_input, replace = T)
      )
    
  })
  
}

shinyApp(ui = ui, server = quick_server)

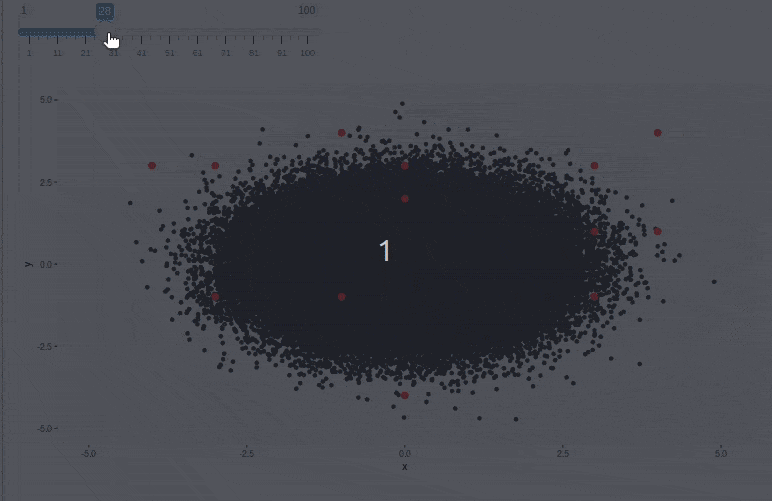
问题在于,我想要交互式更改的图形总是包含许多不活跃且永远不会变化的数据点的“缓慢非反应层”。由于此数据集的大小和renderPlot()总是重新绘制它,因此我交互式更改“反应层”的速度急剧降低。

library(shiny)

ui <- fluidPage(
  
  sliderInput(inputId = "slider_input", label = "Reactive values:", min = 1, max = 100, value = 10),
  plotOutput(outputId = "plotx")
  
)

slow_server <- function(input, output, session){
  
  base_data <- reactiveVal(value = data.frame(x = rnorm(n = 200000), y = rnorm(n = 200000)))
  
  output$plotx <- renderPlot({
    
    # slow non reactive layer
    plot(x = base_data()$x, y = base_data()$y)
    
    # reactive layer
    points(
      x = sample(x = -4:4, size = input$slider_input, replace = T),
      y = sample(x = -4:4, size = input$slider_input, replace = T), 
      col = "red", 
      cex = 5, 
      pch = 19
      )
    
  })
  
}

shinyApp(ui = ui, server = slow_server)

由于基本数据和生成的图形(这里是一堆点)永远不会改变,因此每次重新绘制renderPlot()所有内容(包括“层”)都很烦人。有没有办法“隔离”从非反应性数据集创建的图形?使非反应性的图层不被重新绘制?

我已经尝试使用ggplot2创建一个稳定的层

big_data_frame <- data.frame(x = rnorm(n = 200000), y = rnorm(n = 200000))

steady_layer <- reactiveVal(value = geom_point(data = big_data_frame, mapping = aes(x = x, y = y))

然后像这样创建图形

output$plotx <- renderPlot({

  small_df <- 
   data.frame(
      x = sample(x = -4:4, size = input$slider_input, replace = T),
      y = sample(x = -4:4, size = input$slider_input, replace = T)
    )
  
   ggplot() + 
    steady_layer() +
    geom_point(data = small_df, mapping = aes(x = x, y = y) 
    
})


但这并没有帮助,因为重绘图表的过程需要时间,而不是创建ggplot层本身。

虽然我可以想象解决方案可能是创建一个大图的.png,并将其用作HTML和CSS的背景,通过使其成为反应性UI来为output$plotx。但我还没有成功地操纵HTML和CSS。

任何帮助都会感激。非常感谢!


据我所知,没有办法保持绘图的一部分始终呈现并在其上添加一些“轻量级层”,但我很乐意被证明是错误的。您可以采取的一种缓解此问题的方法是使用caching,这样对于每个值,只有第一次计算会很慢。例如,当输入值为10时,它将很慢,然后您将其更改为15,它也很慢,但如果您回到10,则输出会立即显示,因为它已被缓存。但正如我所说,并不是真正的解决方案。 - bretauv
在回答之前我没有看到这个评论,基本上是相同的想法。 - lz100
1个回答

2
您需要了解如何使用 renderPlot。它首先使用 R 中的 png 函数创建 png 图像,然后将其发送给客户端浏览器。当绘图数据更改时,会重新创建此 png 图像。因此,不可能只重新绘制 png 的一部分。因此,向现有图形添加点始终需要使用 slow points + new points 的时间,因此在当前的闪亮机制下,不可能不重新计算这些慢点。一个可行的选项是使用 plotly代理。它由 HTML 和 Javascript 组成,因此可以进行部分更新。有关详细信息,请参见链接,此处不再重复。根据我的个人经验,它快,但不是您想要的以毫秒为级别的速度。
因此,我有一个聪明的技巧供您使用:为什么要在同一图中进行更新?我们可以使用一个图作为背景,它很慢,但我们只渲染一次,并且我们将永远不会再次触摸它。然后,我们更新另一个仅有少数点的图,并将此图叠放在慢速图上方。
以下是具体步骤:
  1. 添加一些 CSS 技巧以进行叠放
  2. 渲染慢速图
  3. 使用透明度呈现快速图
library(shiny)
library(ggplot2)
ui <- fluidPage(
    
    sliderInput(inputId = "slider_input", label = "Reactive values:", min = 1, max = 100, value = 10),
    div(
        class = "large-plot",
        plotOutput(outputId = "plot_bg"),
        plotOutput(outputId = "plotx")
    ),
    tags$style(
        "
        .large-plot {
            position: relative;
        }
        #plot_bg {
            position: absolute;
        }        
        #plotx {
            position: absolute;
        }
        "
    )
    
    
)

slow_server <- function(input, output, session){
    
    base_data <- reactiveVal(value = data.frame(x = rnorm(n = 200000), y = rnorm(n = 200000)))
    
    output$plot_bg <- renderPlot({
        ggplot(base_data()) +
            geom_point(aes(x,y)) +
            scale_x_continuous(breaks = -4:4) +
            scale_y_continuous(breaks = -4:4) +
            xlim(-5, 5) +
            ylim(-5, 5)
    })
    output$plotx <- renderPlot({
        data.frame(
            x = sample(x = -4:4, size = input$slider_input, replace = T),
            y = sample(x = -4:4, size = input$slider_input, replace = T)
        ) %>% 
            ggplot() +
                geom_point(aes(x,y), color = "red", size = 3) + 
                scale_x_continuous(breaks = -4:4) +
                scale_y_continuous(breaks = -4:4) +
            theme(
                panel.background = element_rect(fill = "transparent"),
                plot.background = element_rect(fill = "transparent", color = NA), 
                panel.grid.major = element_blank(), 
                panel.grid.minor = element_blank(), 
                legend.background = element_rect(fill = "transparent"), 
                legend.box.background = element_rect(fill = "transparent")
            )+
            xlim(-5, 5) +
            ylim(-5, 5)
    }, bg="transparent")
    
}

shinyApp(ui = ui, server = slow_server)

enter image description here


就是这样!非常感谢!!! :) 只是为了我的理解:CSS 代码 #blot_bg... 和 #plotx 没有被执行,对吗?唯一相关的代码是 .large-plot 部分? - kuecki95
你好Iz100,我已经采用了你的解决方案。再次感谢。这正是我要找的。由于应用程序的设计,我现在遇到了另一个关于其他元素定位的问题。我在这里提出了问题(https://dev59.com/oHANtIcB2Jgan1zn0cgi)。由于你似乎在CSS方面很有技巧,我认为这对你来说很容易回答。如果你能看一下,我会非常感激。非常感谢! - kuecki95
@kuecki95,你需要在CSS中加入#plot_bg#plotx,否则两个图表将无法堆叠。 - lz100

网页内容由stack overflow 提供, 点击上面的
可以查看英文原文,
原文链接