将自定义颜色渐变映射到POSIXct值

3

数据:

df1 <- structure(list(Index = 1:11, Duration = structure(c(1487577655, 
1487577670, 1487577675, 1487577680, 1487577685, 1487577680, 1487577700, 
1487577705, 1487577695, 1487577700, 1487577680), class = c("POSIXct", 
"POSIXt"), tzone = "")), .Names = c("Index", "Duration"), class = "data.frame", row.names = 3:13)
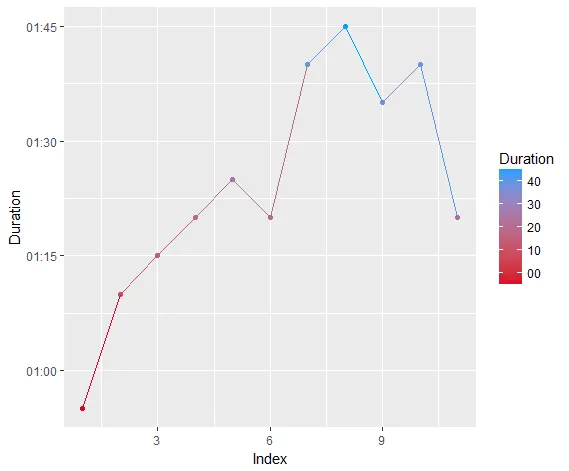
现在我按照以下方式构建图表:
g1 <- ggplot(df1, aes(x = Index, y = Duration, color = Duration))+
geom_point()+
geom_line()+
scale_y_datetime(labels = date_format("%M:%S"))

目前,颜色比例尺被设置为默认的“黑色”到“蓝色”的渐变。

问题在于,我尝试将自定义渐变应用到数据时出现错误。

对于非POSIXct对象:

scale_color_gradient("Duration", low = "#D80427", high = "#07a0ff", space = "Lab")

我能运行,但使用POSIXct对象df1 $ Duration 作为解释变量时出现以下错误:

Error in Ops.POSIXt((x - from[1]), diff(from)) : '/' not defined for "POSIXt" objects

当绘制POSIXct对象的图形时,是否需要使用不同的梯度函数?


尝试使用 color = as.numeric(Duration) - zx8754
2个回答

4
你可以使用 trans = time_trans():
library(ggplot2)
library(scales)
g1 +
  scale_color_gradient("Duration", low = "#D80427", high = "#07a0ff",
                       trans = time_trans())

如果您希望图例中的标签以另一种格式呈现,例如添加labels = format(pretty(df1$Duration), "%M:%S")

在这里输入图片描述


1
我们可以将日期转换为数字来表示颜色:
library(ggplot2)
library(scales)

ggplot(df1, aes(x = Index, y = Duration, color = as.numeric(Duration))) +
  geom_point() +
  geom_line() +
  scale_y_datetime(labels = date_format("%M:%S")) +
  scale_color_gradient("Duration", low = "#D80427", high = "#07A0FF",
                       labels = c("00", "10", "20", "30", "40"))

@Henrik所建议的,为避免硬编码标签,请使用以下内容:

# avoid hardcoding labels using pretty()
ggplot(df1, aes(x = Index, y = Duration, color = as.numeric(Duration))) +
  geom_point() +
  geom_line() +
  scale_y_datetime(labels = date_format("%M:%S")) +
  scale_color_gradient("Duration", low = "#D80427", high = "#07A0FF",
                       breaks = pretty(as.numeric(df1$Duration)),
                       labels = format(pretty(df1$Duration), "%M:%S"))

1
那个完美地运作了。我的第二个担忧是,如果将其转换为数字是否会保留时间之间的相对距离,而对前两个数字值进行快速测试显示1487577670 - 1487577655 = 15,这等同于使用前两个时间值1:10 - 00:55 = 15。所以看起来在所有方面都是一个好的解决方案。感谢您的帮助! - Mako212
@zx8754 如果你使用 breaks = pretty(as.numeric(df1$Duration)), labels = format(pretty(df1$Duration), "%M:%S")(或者任何你想要的 format),就可以避免硬编码标签。 - Henrik

网页内容由stack overflow 提供, 点击上面的
可以查看英文原文,
原文链接