Matplotlib.contourf的等级是否取决于色图中颜色的数量?

7

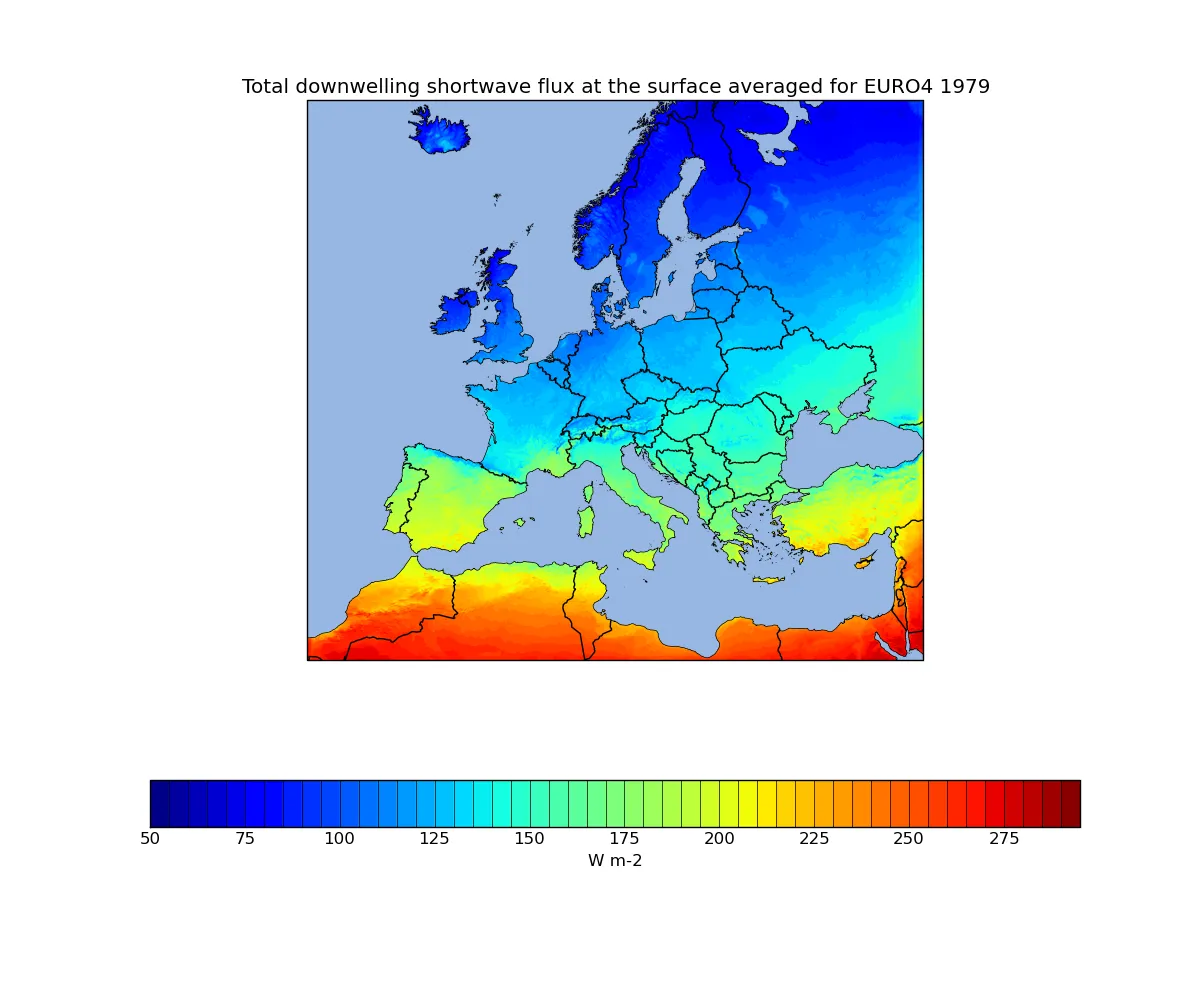
我正在使用contourf绘制地图,通常会选择默认的彩虹色调,级别为50。

#Various imports
#LOTS OF OTHER CODE BEFORE
plot = plt.contourf(to_plot, 50)
plt.show()
#LOTS OF OTHER CODE AFTER

以下是输出结果。我还做了一些其他的工作来获得海岸线等信息。如果有人感兴趣,它是使用iris和cartopy完成的。
现在我已经决定不使用彩虹图例,而是使用一些Cynthia Brewer颜色: 这是结果
brewer_cmap = mpl.cm.get_cmap('brewer_Reds_09')
plot = iplt.contourf(to_plot, 50, cmap=brewer_cmap) # expect 50 levels

然而输出结果是: This is the result

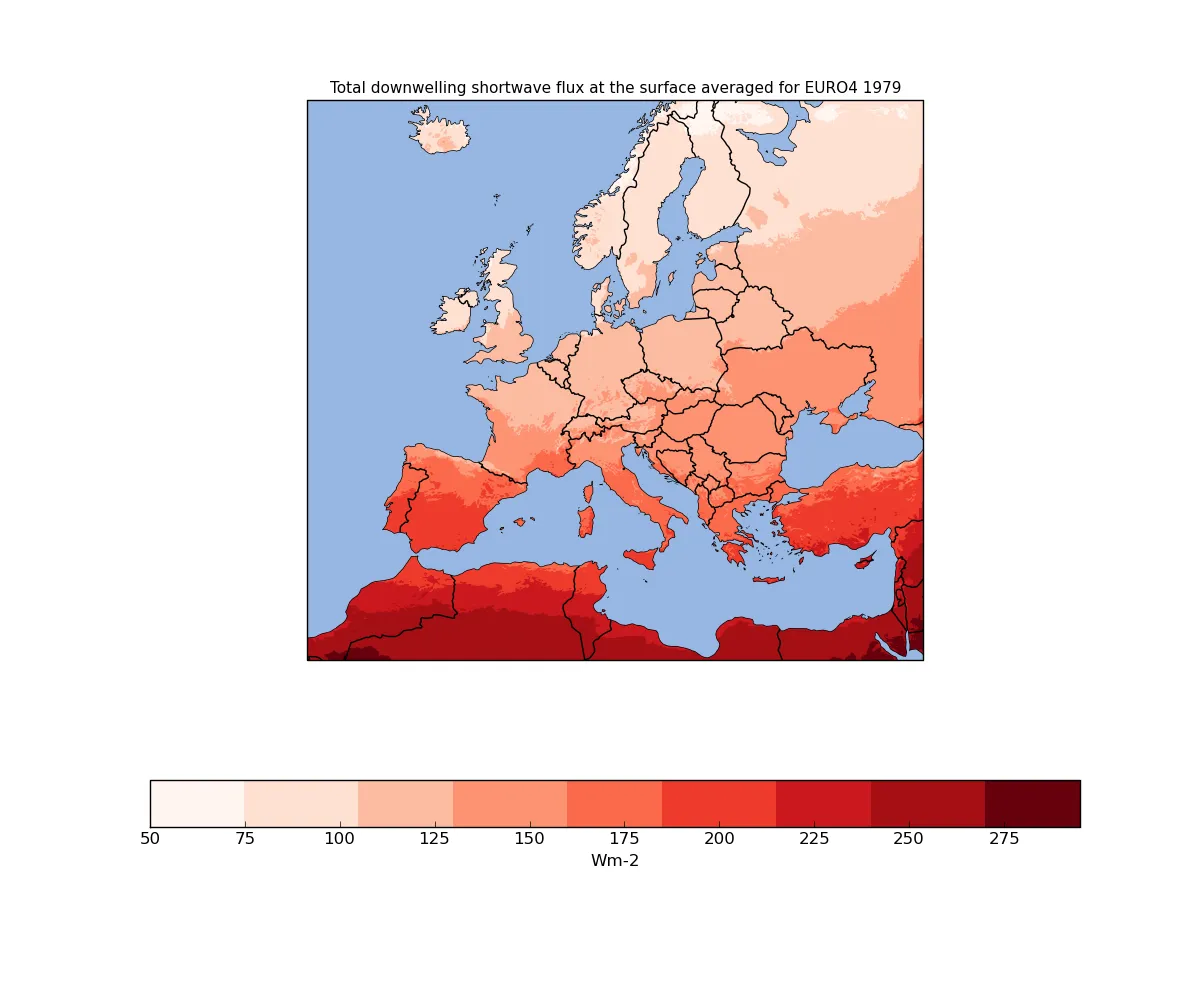
你可以在这里看到,这个调色板只有9种颜色。所以我的问题是,contourf的级别是否受到色彩地图中可用颜色数量的限制?我很喜欢这张地图,想知道是否有可能生成一个新地图,它像原来的地图一样但更多红色级别?
我希望能够捕捉数据的变化性,因此增加更多等高线级别似乎是个好主意,但我想放弃彩虹色系列,仅选用基于单一颜色的方案。
谢谢!
1个回答

4

是的,这是一种离散的彩色地图,如果您想要一个连续的地图,您需要制作一个定制的彩色地图。

#the colormap data can be found here: https://github.com/SciTools/iris/blob/master/lib/iris/etc/palette/sequential/Reds_09.txt

In [22]:

%%file temp.txt
1.000000 0.960784 0.941176
0.996078 0.878431 0.823529
0.988235 0.733333 0.631373
0.988235 0.572549 0.447059
0.984314 0.415686 0.290196
0.937255 0.231373 0.172549
0.796078 0.094118 0.113725
0.647059 0.058824 0.082353
0.403922 0.000000 0.050980
Overwriting temp.txt
In [23]:

c_array = np.genfromtxt('temp.txt')
from matplotlib.colors import LinearSegmentedColormap
plt.register_cmap(name='Test', data={key: tuple(zip(np.linspace(0,1,c_array.shape[0]), c_array[:,i], c_array[:,i])) 
                                         for key, i in zip(['red','green','blue'], (0,1,2))})
In [24]:

plt.contourf(X, Y, Z, 50, cmap=plt.get_cmap('Test'))
plt.colorbar()
Out[24]:
<matplotlib.colorbar.Colorbar instance at 0x108948320>

enter image description here


谢谢,这回答了我的问题。不过还有一件事,你能否解释一下这段代码的作用:data={key: tuple(zip(np.linspace(0,1,c_array.shape[0]), c_array[:,i], c_array[:,i])) for key, i in zip(['red','green','blue'], (0,1,2))} 我担心我的 Python 不够强大 :)。 - areuexperienced
1
{}之间的部分被称为字典推导式。基本上它将生成一个制作“colormap”所需的字典。请参见:http://matplotlib.org/examples/pylab_examples/custom_cmap.html,了解该字典应该是什么样子的。干杯! - CT Zhu

网页内容由stack overflow 提供, 点击上面的
可以查看英文原文,
原文链接