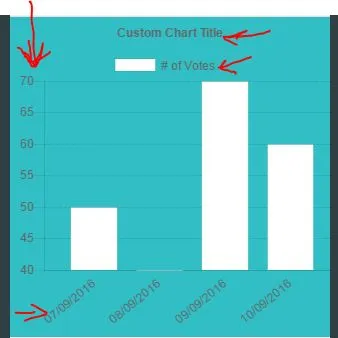
更改X和Y轴字体颜色

29
我该如何更改X和Y轴标签的颜色? 我尝试在scaleLabel中使用fontColor,但可能是在错误的位置上使用了它?
我尝试将其应用于scale中,如源代码中可以找到。 我还尝试在scales下甚至在xAxes中使用它。
var options = {
type: 'bar',
    data: {
        labels: ["Red", "Blue", "Yellow", "Green", "Purple", "Orange"],
        datasets: [{
            label: '# of Votes',
            data: [12, 19, 3, 5, 2, 3],
            backgroundColor: 'red',
            borderWidth: 1
        }]
    },
    options: {
        scale: {
            scaleLabel:{
                fontColor: 'red'
            }
        },
        scales: {
            yAxes: [{
                ticks: {
                    beginAtZero:true
                }
            }]
        }
    }
 };

在线复制

enter image description here

我一直在查看文档,但对我来说并不是很清晰。 由于chart.js没有提供足够的示例,有时很难找到东西...
5个回答

53

$(function(){
var ctx = document.getElementById("myChart");
//Chart.defaults.global.defaultFontColor='red';
var myChart = new Chart(ctx, {
    type: 'bar',
    data: {
        labels: ["Red", "Blue", "Yellow", "Green", "Purple", "Orange"],
        datasets: [{
            label: '# of Votes',
            data: [12, 19, 3, 5, 2, 3],
            backgroundColor: [
                'rgba(255, 99, 132, 0.2)',
                'rgba(54, 162, 235, 0.2)',
                'rgba(255, 206, 86, 0.2)',
                'rgba(75, 192, 192, 0.2)',
                'rgba(153, 102, 255, 0.2)',
                'rgba(255, 159, 64, 0.2)'
            ],
            borderColor: [
                'rgba(255,99,132,1)',
                'rgba(54, 162, 235, 1)',
                'rgba(255, 206, 86, 1)',
                'rgba(75, 192, 192, 1)',
                'rgba(153, 102, 255, 1)',
                'rgba(255, 159, 64, 1)'
            ],
            borderWidth: 1
        }]
    },
    options: {
       legend:{labels: {fontColor: 'orange'}},
      title: {
            display: true,
            fontColor: 'blue',
            text: 'Custom Chart Title'
        },
        scales: {
            yAxes: [{
                ticks: {
                    beginAtZero:true,
                    fontColor: 'red'
                },
            }],
          xAxes: [{
                ticks: {
                    fontColor: 'green'
                },
            }]
        } 
        
    }
});
});
<script src="https://ajax.googleapis.com/ajax/libs/jquery/2.0.3/jquery.min.js"></script>
<script src="https://cdnjs.cloudflare.com/ajax/libs/Chart.js/2.3.0/Chart.min.js"></script>
<canvas id="myChart" width="400" height="400"></canvas>

您可以在特定轴的 ticks/label/legend:labels 中使用 fontColor,用于字体颜色设置。
options: {
        legend: {
             labels: {
                  fontColor: 'orange'
                 }
              },
        title: {
            display: true,
            fontColor: 'blue',
            text: 'Custom Chart Title'
        }     ,
        scales: {
            yAxes: [{
                ticks: {
                    beginAtZero:true,
                    fontColor: 'red'
                },
            }],
          xAxes: [{
                ticks: {
                    fontColor: 'green'
                },
            }]
        } 

    }

或者可以将 defaultFontColor 更改为在画布上绘制的所有文本元素的字体颜色。

 Chart.defaults.global.defaultFontColor='red';

我已经更新了我的代码,之前我写的是为图表库 chart.js 1.x 版本所编写。我查看了源码并发现必须在 ticks 内部进行更改。 - Sahil
1
你在文档中找不到吗?对我来说,被迫检查源代码来完成这样一个简单的任务似乎非常奇怪。 - Alvaro
是的,文档不够清晰,需要一些时间来理解。我已经添加了一个片段来更改图表中标题、图例、比例尺和标签的字体颜色。 - Sahil

4

虽然我可能晚了回答这个问题,但这个答案可能对那些正在寻找答案的人有用。

在Chart.js中,我们可以使用以下设置来设置刻度标签和刻度线的样式。

options: {
    scales: {
        xAxes: [{
            display: true,
            scaleLabel: { // To format the scale label
                display: true,
                labelString: 'X axis name',
                fontColor: '#000000',
                fontSize: 10
            },
            ticks: {
                fontColor: "black", // To format the ticks, coming on the axis/labels which we are passing
                fontSize: 14
            }
        }],
        yAxes: [{
            display: true,
            scaleLabel: {
                display: true,
                labelString: 'Y axis name',
                fontColor: '#000000',
                fontSize: 10
            },
            ticks: {
                fontColor: "black",
                fontSize: 14
            }
        }]
    }
}

请参考Chart.js文档获取所有属性。在实现前请仔细研究所有属性。
祝愉快编码!

3

React JS - 创建 React 应用

"chart.js": "^3.7.0",
"react-chartjs-2": "^4.0.0",

我曾经遇到过这个问题,但是不幸的是接受的答案对我并没有起作用。然后我稍微调整了一下它,使它工作了。

这就是我最终得到的东西,希望对某些人有所帮助...

输入图像描述

const options = {
    responsive: true,
    maintainAspectRatio: false,
    plugins: {
        legend: {
            position: 'top',
            labels: {
                color: "#ffffff",
            }
        },
        title: {
            display: true,
            text: 'License Usage',
            color: "#ffffff"
        },
    },
    scales: {
        yAxes: {
            ticks: {
                color: "#ffffff"
            },
        },
        xAxes: {
            ticks: {
                color: "#ffffff"
            },
        }
    },
};

0
如果我们将选项设置如下,则轴标签值的字体颜色会更改。例如,我在 jsfiddle 上尝试过它,并且它有效。同样,在我的 Rails 应用程序中,也可以使用相同的方法。
options: {
    scales: {
        yAxes: [{
            ticks: {
                beginAtZero:true,
                fontColor:'red'
            }
        }]
    }
}

...


0

若要更改图表对象的刻度和轴标签,请按照以下步骤操作:

let changeItemColor = (item) => {
    item.scaleLabel.fontColor = color;
    item.ticks.fontColor = color;
    item.ticks.minor.fontColor = color;
    item.ticks.major.fontColor = color;
};
chart.options.scales.xAxes.forEach((item) => changeItemColor(item));
chart.options.scales.yAxes.forEach((item) => changeItemColor(item));
chart.update();

网页内容由stack overflow 提供, 点击上面的
可以查看英文原文,
原文链接