将ggplot2图形导出到Word文档的最佳方法是什么?

3
我创建了一些很棒的图表,想要将它们导出到我的Word文档中。是的,应该用Markdown写,但是...你知道的...总有一天!
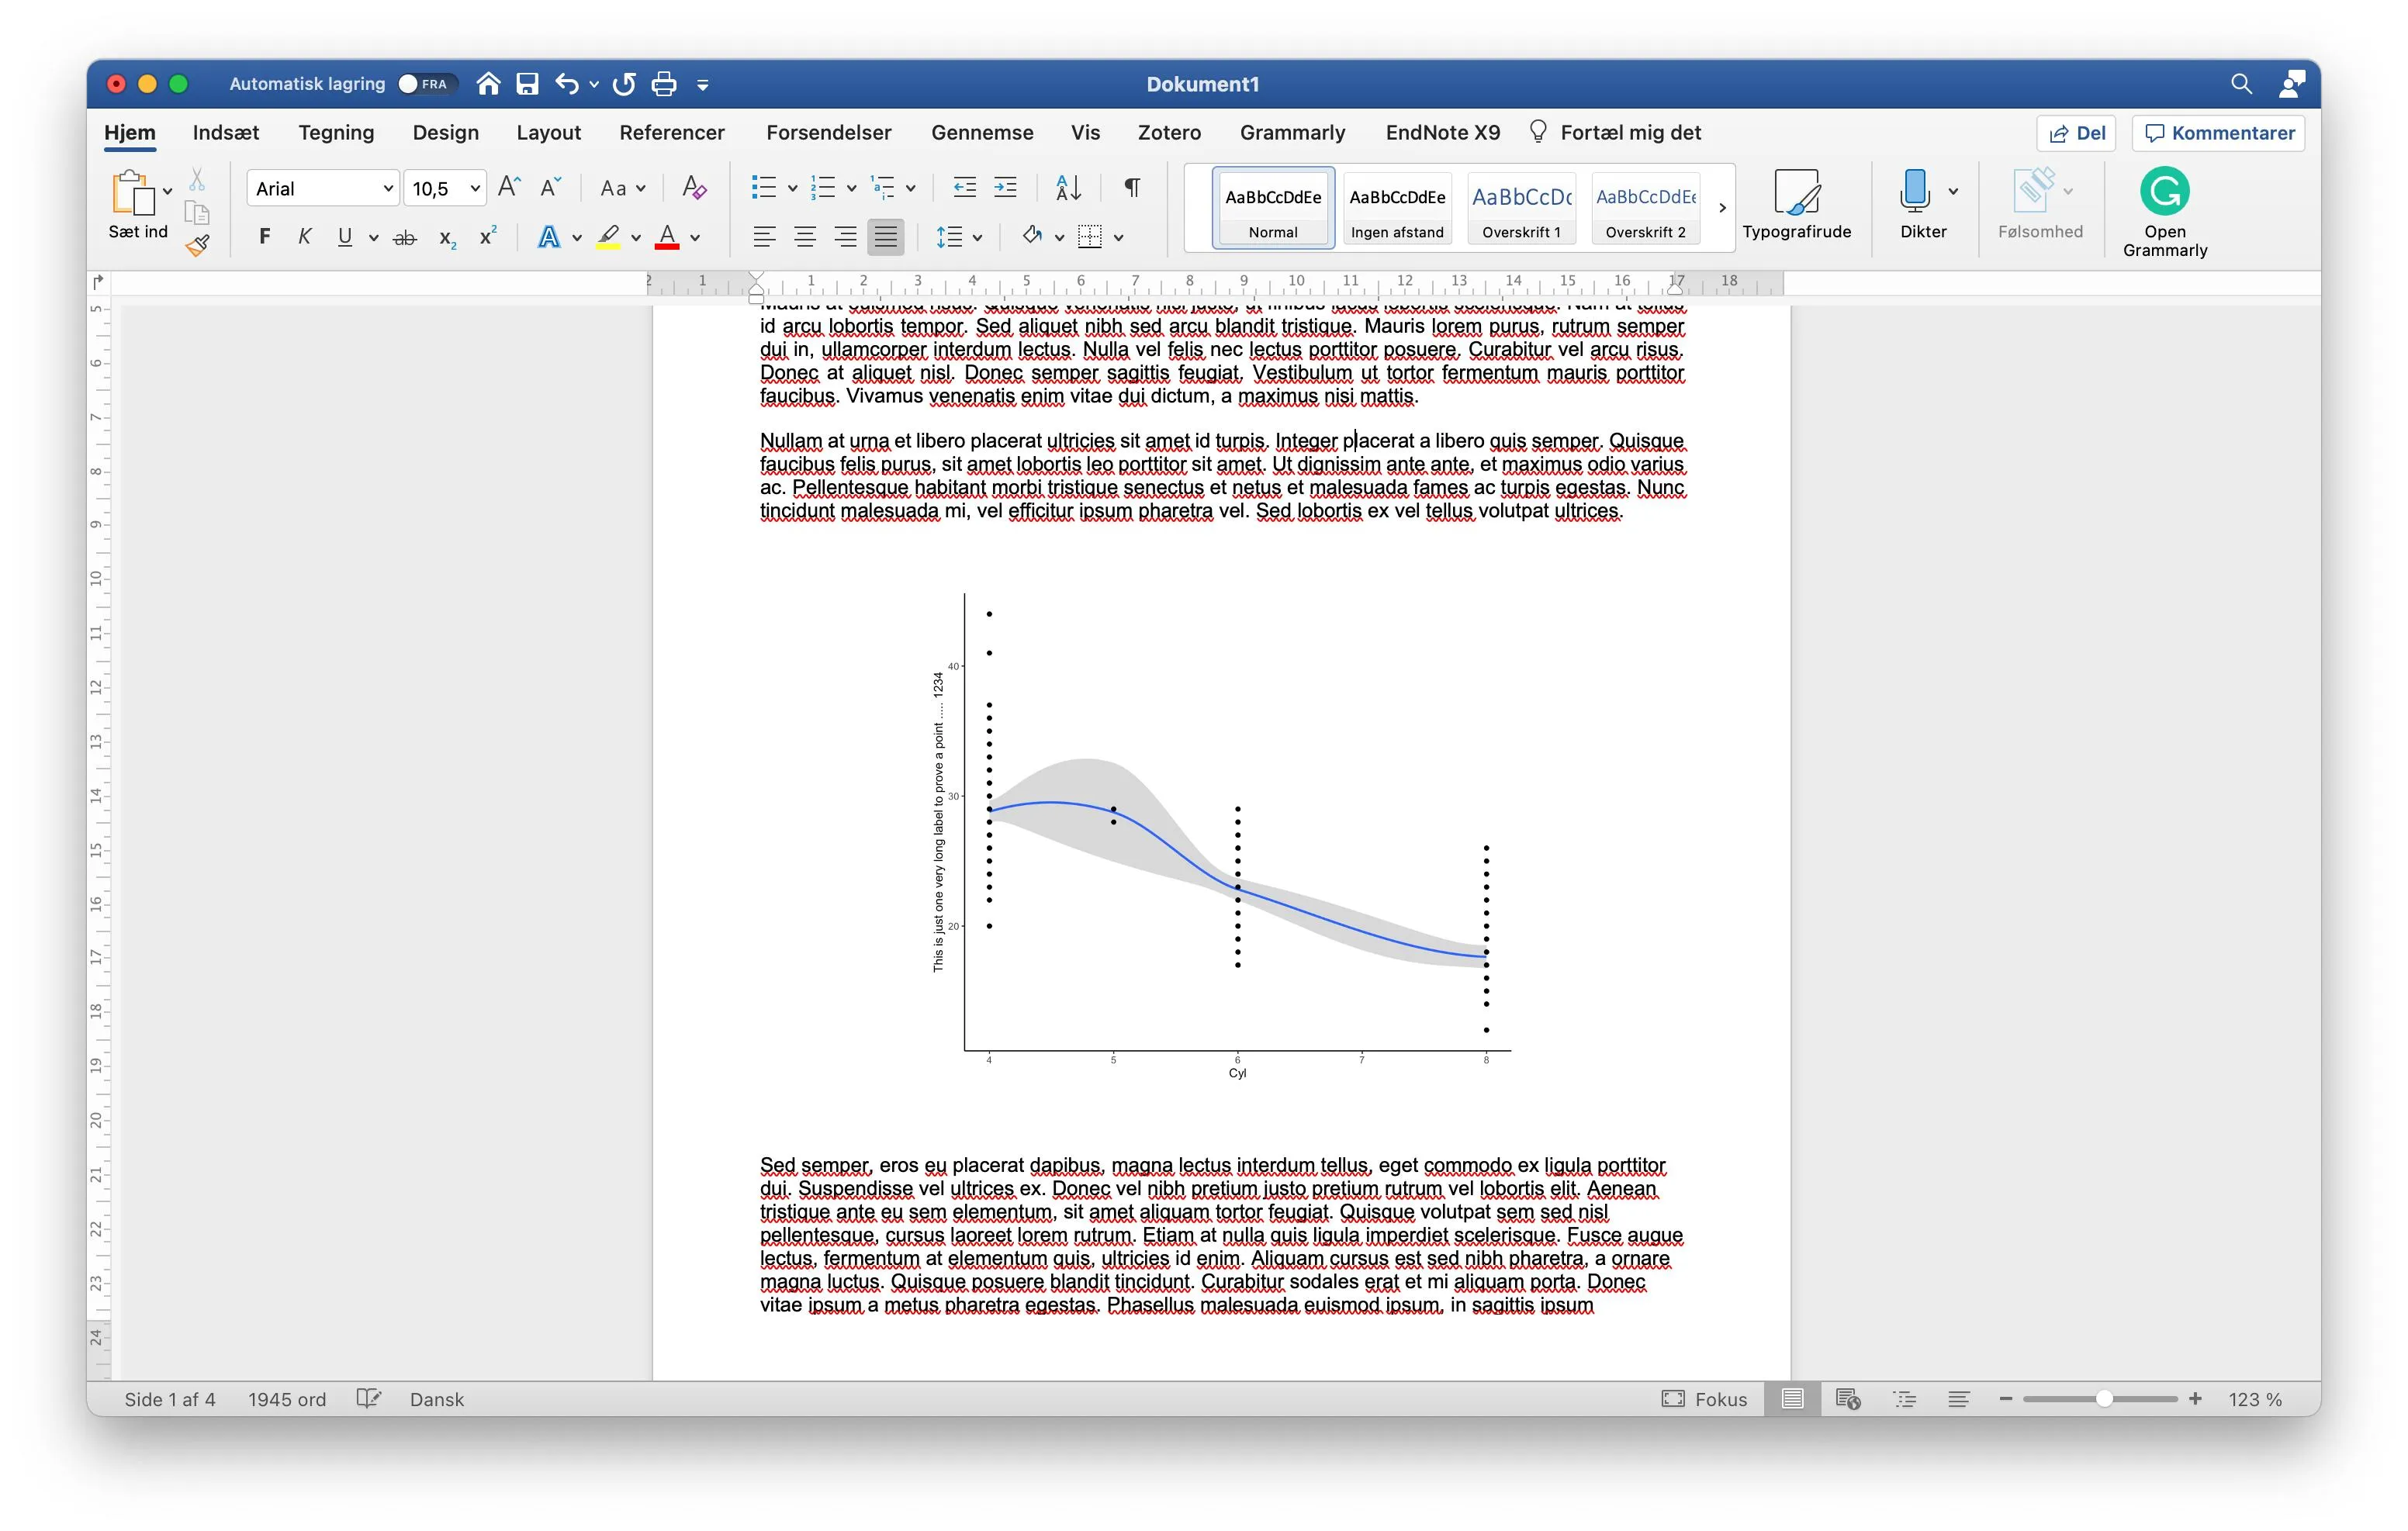
然而,我该如何调整图表的大小以使标签保持在“范围内”?请参见以下示例(代码位于文档末尾)。
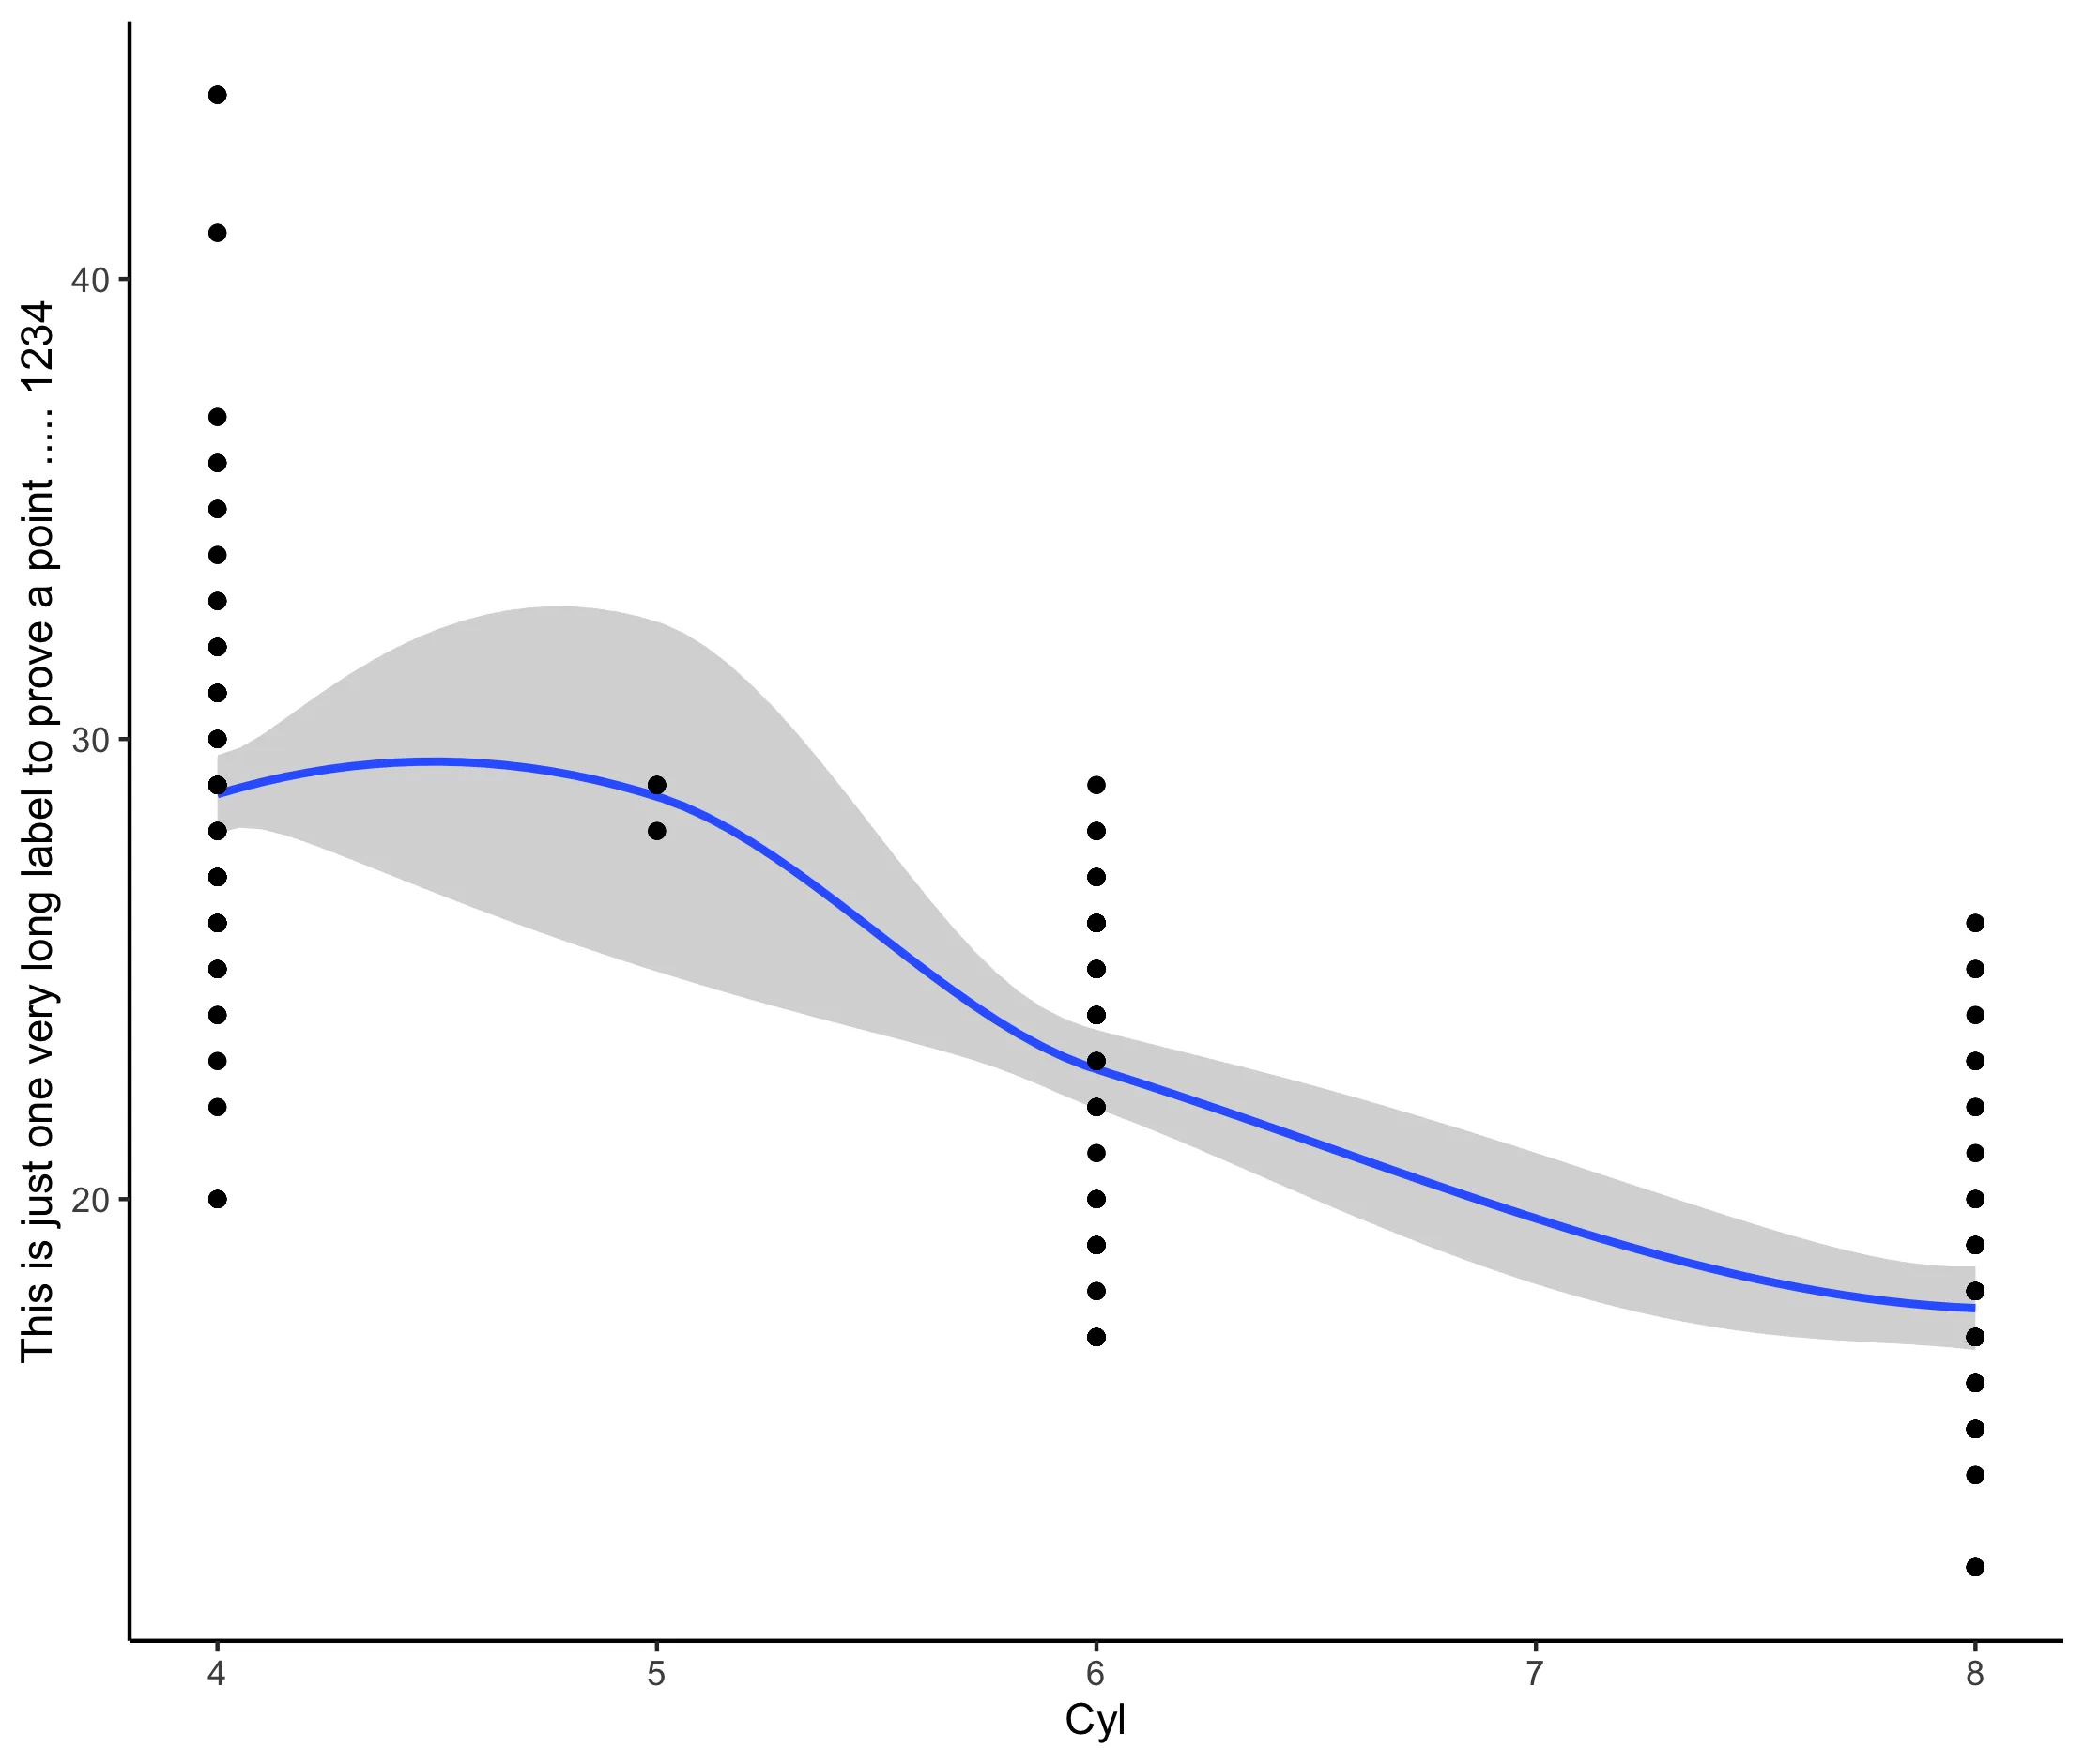
我想将以下图表插入到我的Word文档中:

Test picture

看起来很棒!但当我将其插入文档中时就不一样了:

Word screenshot

标签太小了,我想把它们纵向拉伸,使宽度大于高度。所以我成功地制作出了这个:

enter image description here

这是我遇到的问题,如何让标签保持在范围内?是否有更好的方法来适应 Word 文档而不是猜测正确的尺寸?
谢谢!
这是代码:
library(ggplot2)

df <- mpg # Load sample data

# First test graph 
ggplot(data = df, mapping = aes(cyl, hwy)) +
  geom_smooth() +
  geom_point() +
  geom_point() +
  labs(y = "This is just one very long label to prove a point ..... 1234",
       x = "Cyl") +
  theme_classic() +
  theme(legend.title = element_blank())

ggsave("test1.png")

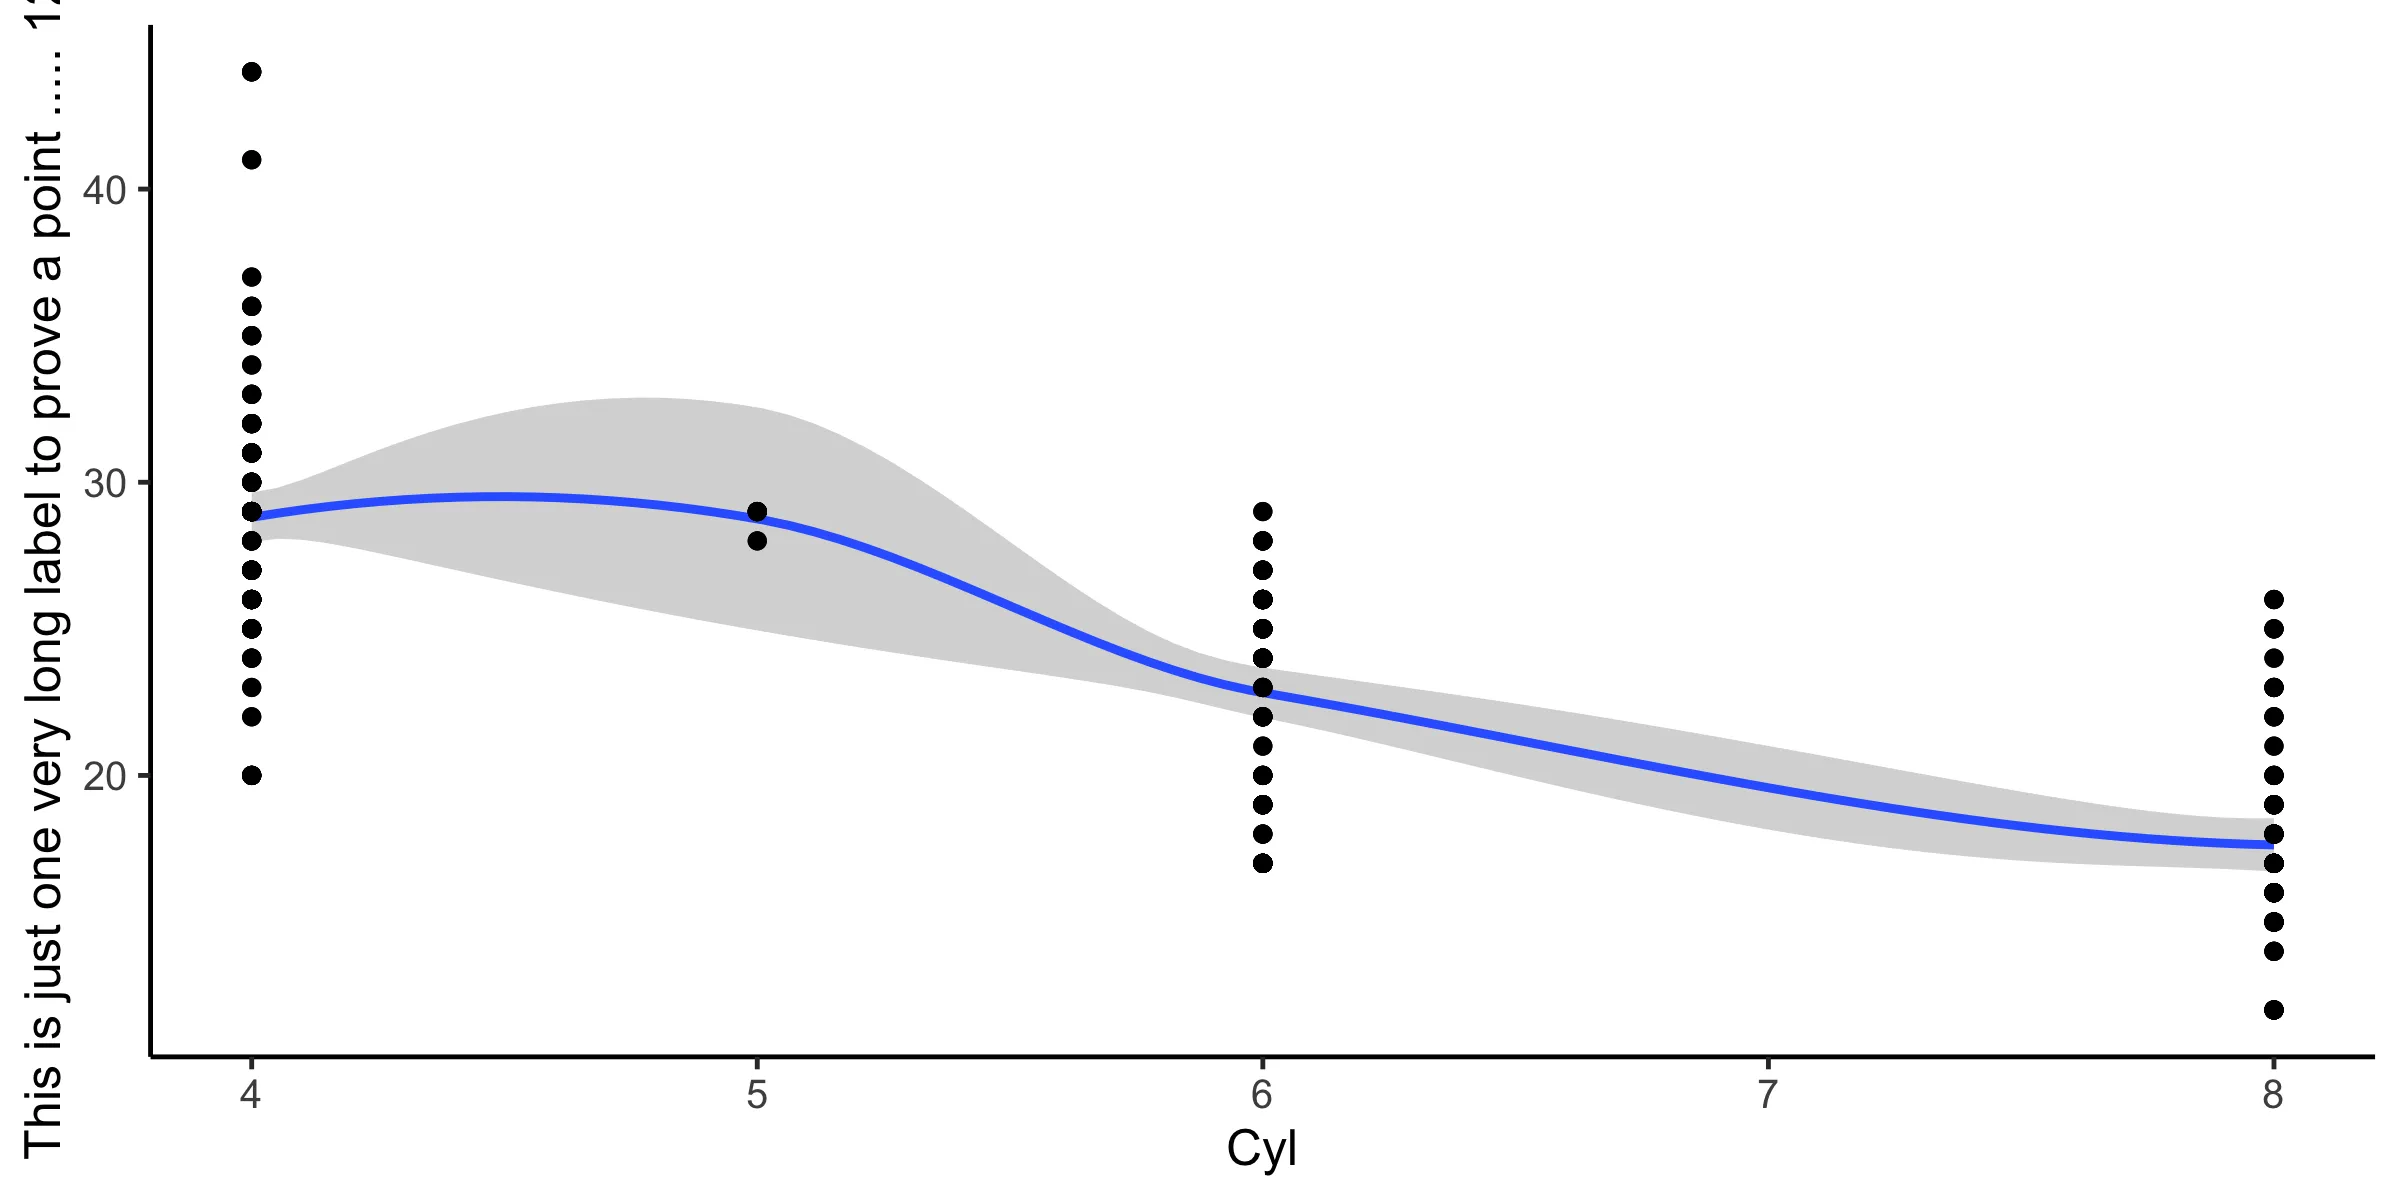
# Modified test graph to add fit the Word document

ggplot(data = df, mapping = aes(cyl, hwy)) +
  geom_smooth() +
  geom_point() +
  geom_point() +
  labs(y = "This is just one very long label to prove a point ..... 1234",
       x = "Cyl") +
  theme_classic(base_size = 12) + # SIZE CHANGED
  theme(legend.title = element_blank())

ggsave("test2.png", width = 8, height = 4) # DIMENSIONS DEFINED

1
嗨,你看到警官的包裹了吗? - MrSmithGoesToWashington
1个回答

1
我通常使用的解决方案包括上述提到的officer包。以前,这个包可以将图形导出为矢量对象到docx文件中,因此您可以在文档中更改图形的大小和文本。但似乎在最近的版本中已经停用了,但仍适用于powerpoint。以下代码将图形放置在powerpoint幻灯片中作为分组形状,您可以在复制到word之前对其进行微调:
library(ggplot2)
library(officer)
library(tidyverse)

df <- mpg # Load sample data

# First test graph 
plot2 <- ggplot(data = df, mapping = aes(cyl, hwy)) +
  geom_smooth() +
  geom_point() +
  geom_point() +
  labs(y = "This is just one very long label to prove a point ..... 1234",
       x = "Cyl") +
  theme_classic(base_size = 12) + # SIZE CHANGED
  theme(legend.title = element_blank())

pptx <- read_pptx()

pptx %>% 
  add_slide() %>% 
  # This first line puts it in as a static png image for comparison
  ph_with(plot2, location = ph_location_type(type = "body")) %>% 
  add_slide() %>% 
  # This line puts in a shape object, which can be ungrouped and edited
  ph_with(rvg::dml(ggobj = plot2),
          width = 8,
          height = 4, 
          location = ph_location_type(type = "body"))

#> pptx document with 2 slide(s)

print(pptx, "test_graph.pptx")

本文创建于2020年12月08日,使用reprex package (v0.3.0)。

这是一种有点小技巧的解决方案,至少让你可以对大小进行视觉控制。以前可以通过export包(在GitHub上可用)更轻松地提供此功能,但它现在不在CRAN上了,并且在幕后使用了已停用的officer部分将矢量图形放入docx文档中。


编辑:请参见此GitHub问题,了解为什么通过 officer 转换矢量图形到docx不再是可选项。


网页内容由stack overflow 提供, 点击上面的
可以查看英文原文,
原文链接