如何使用Python找到图像中圆形的平均RGB值?

4

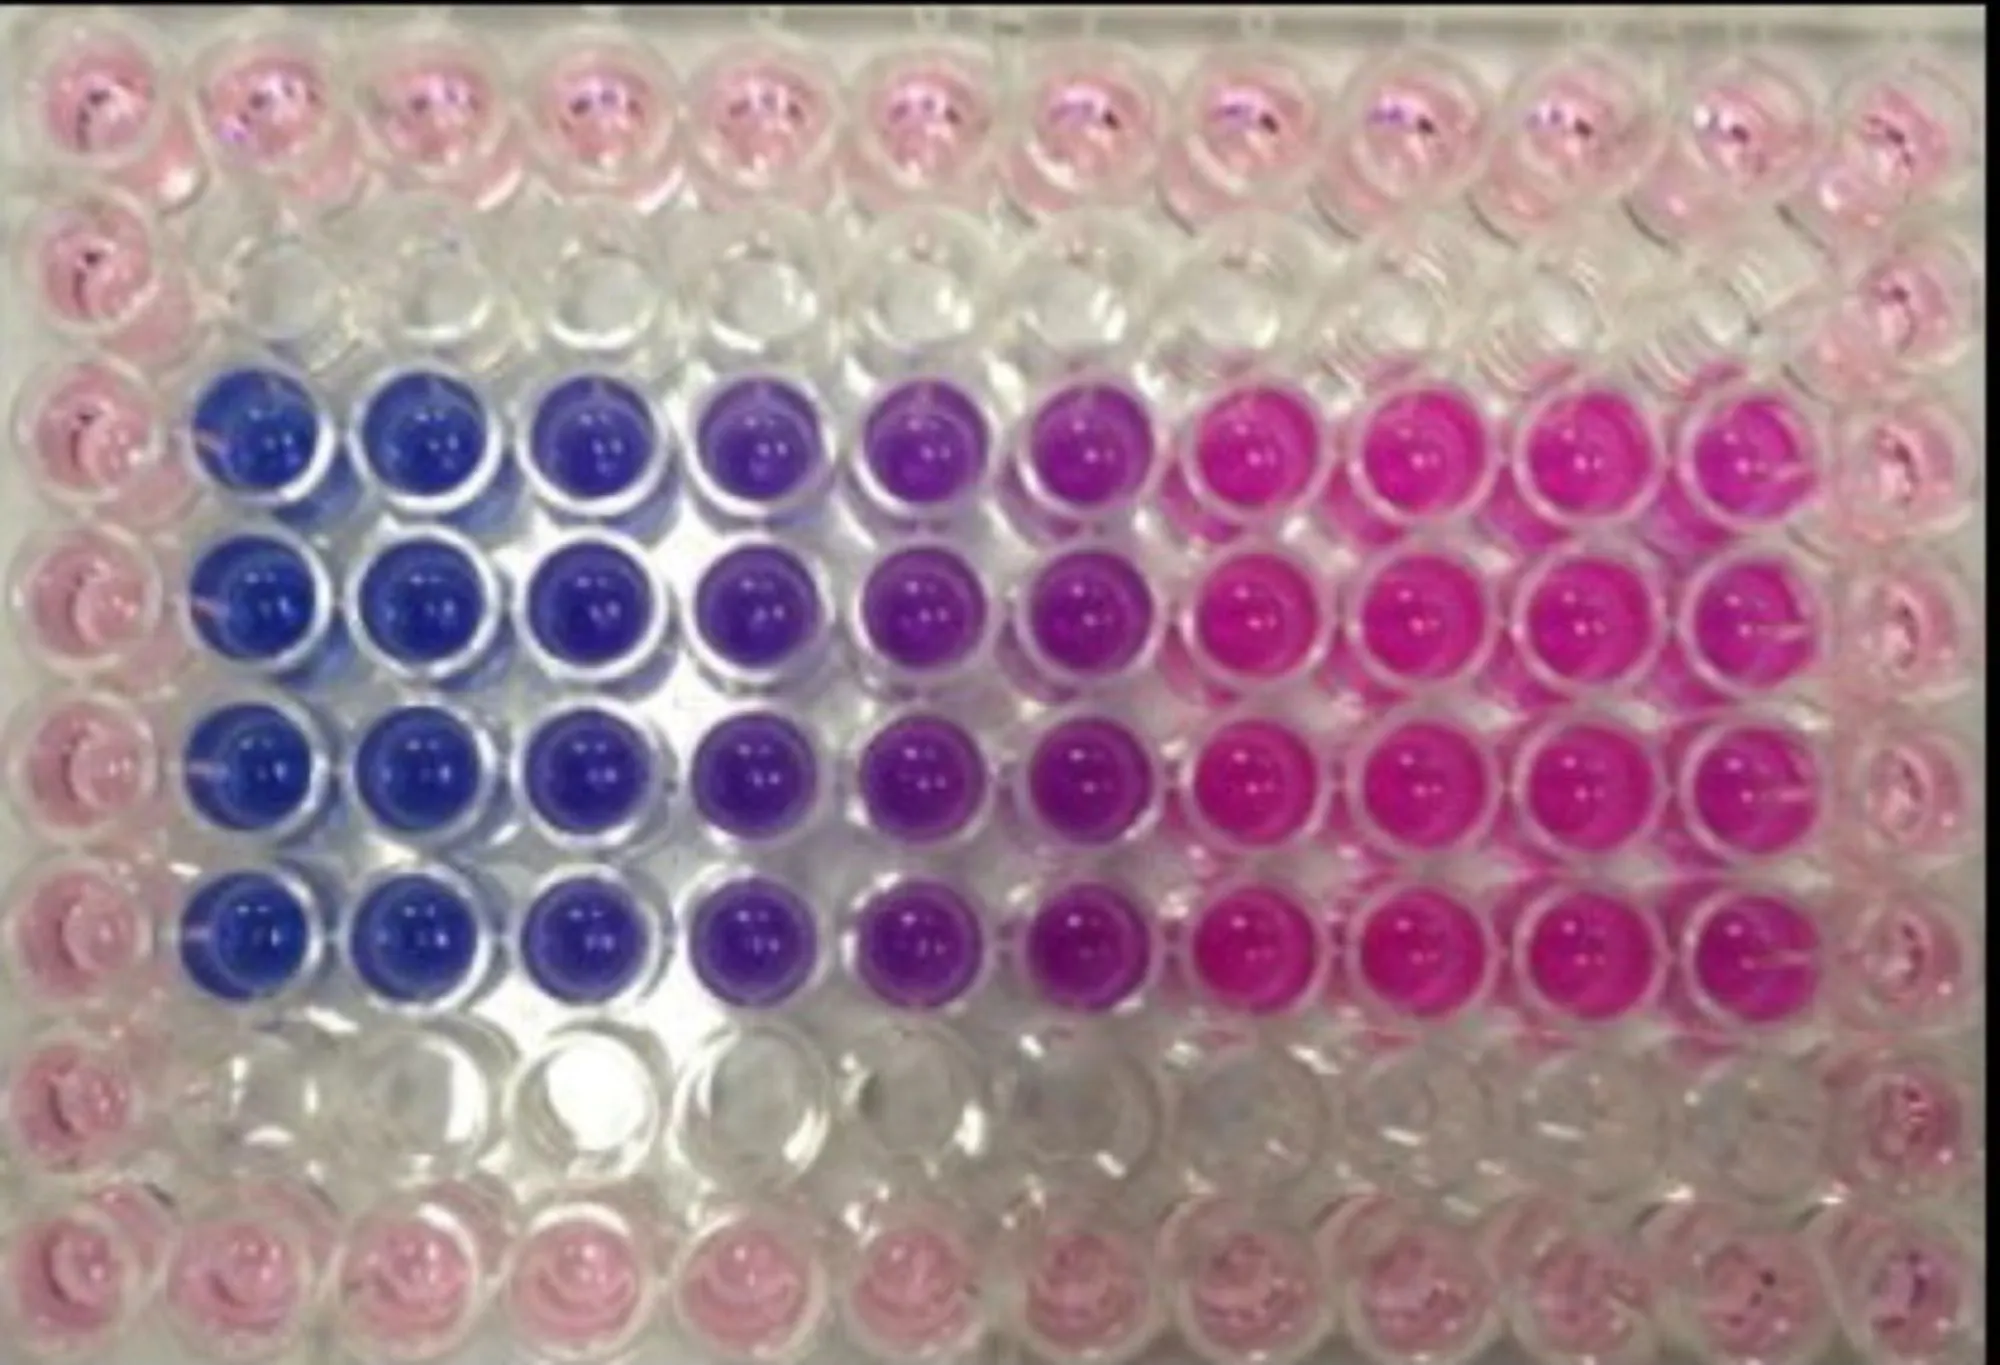
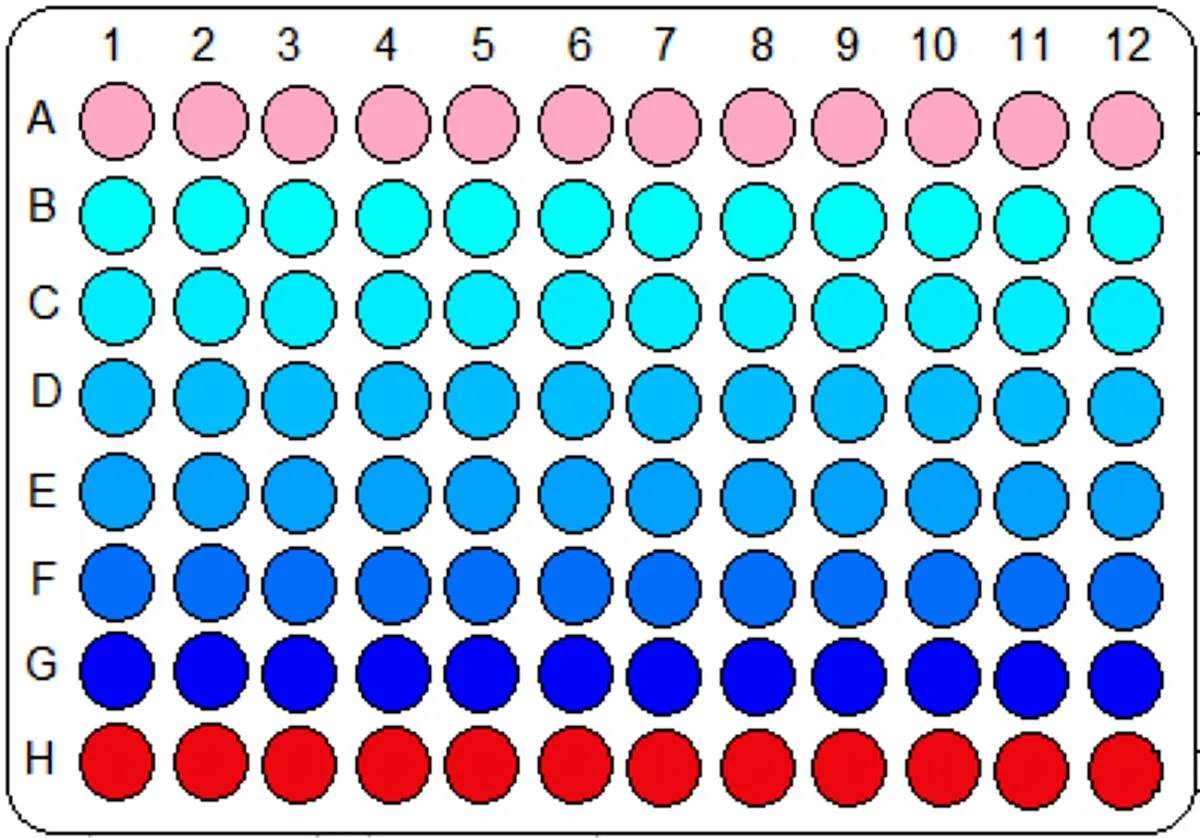
我正在帮助一位同事,他使用一种非常古老的比色法来测量细胞死亡。为了简化问题,这里是一个示意图:
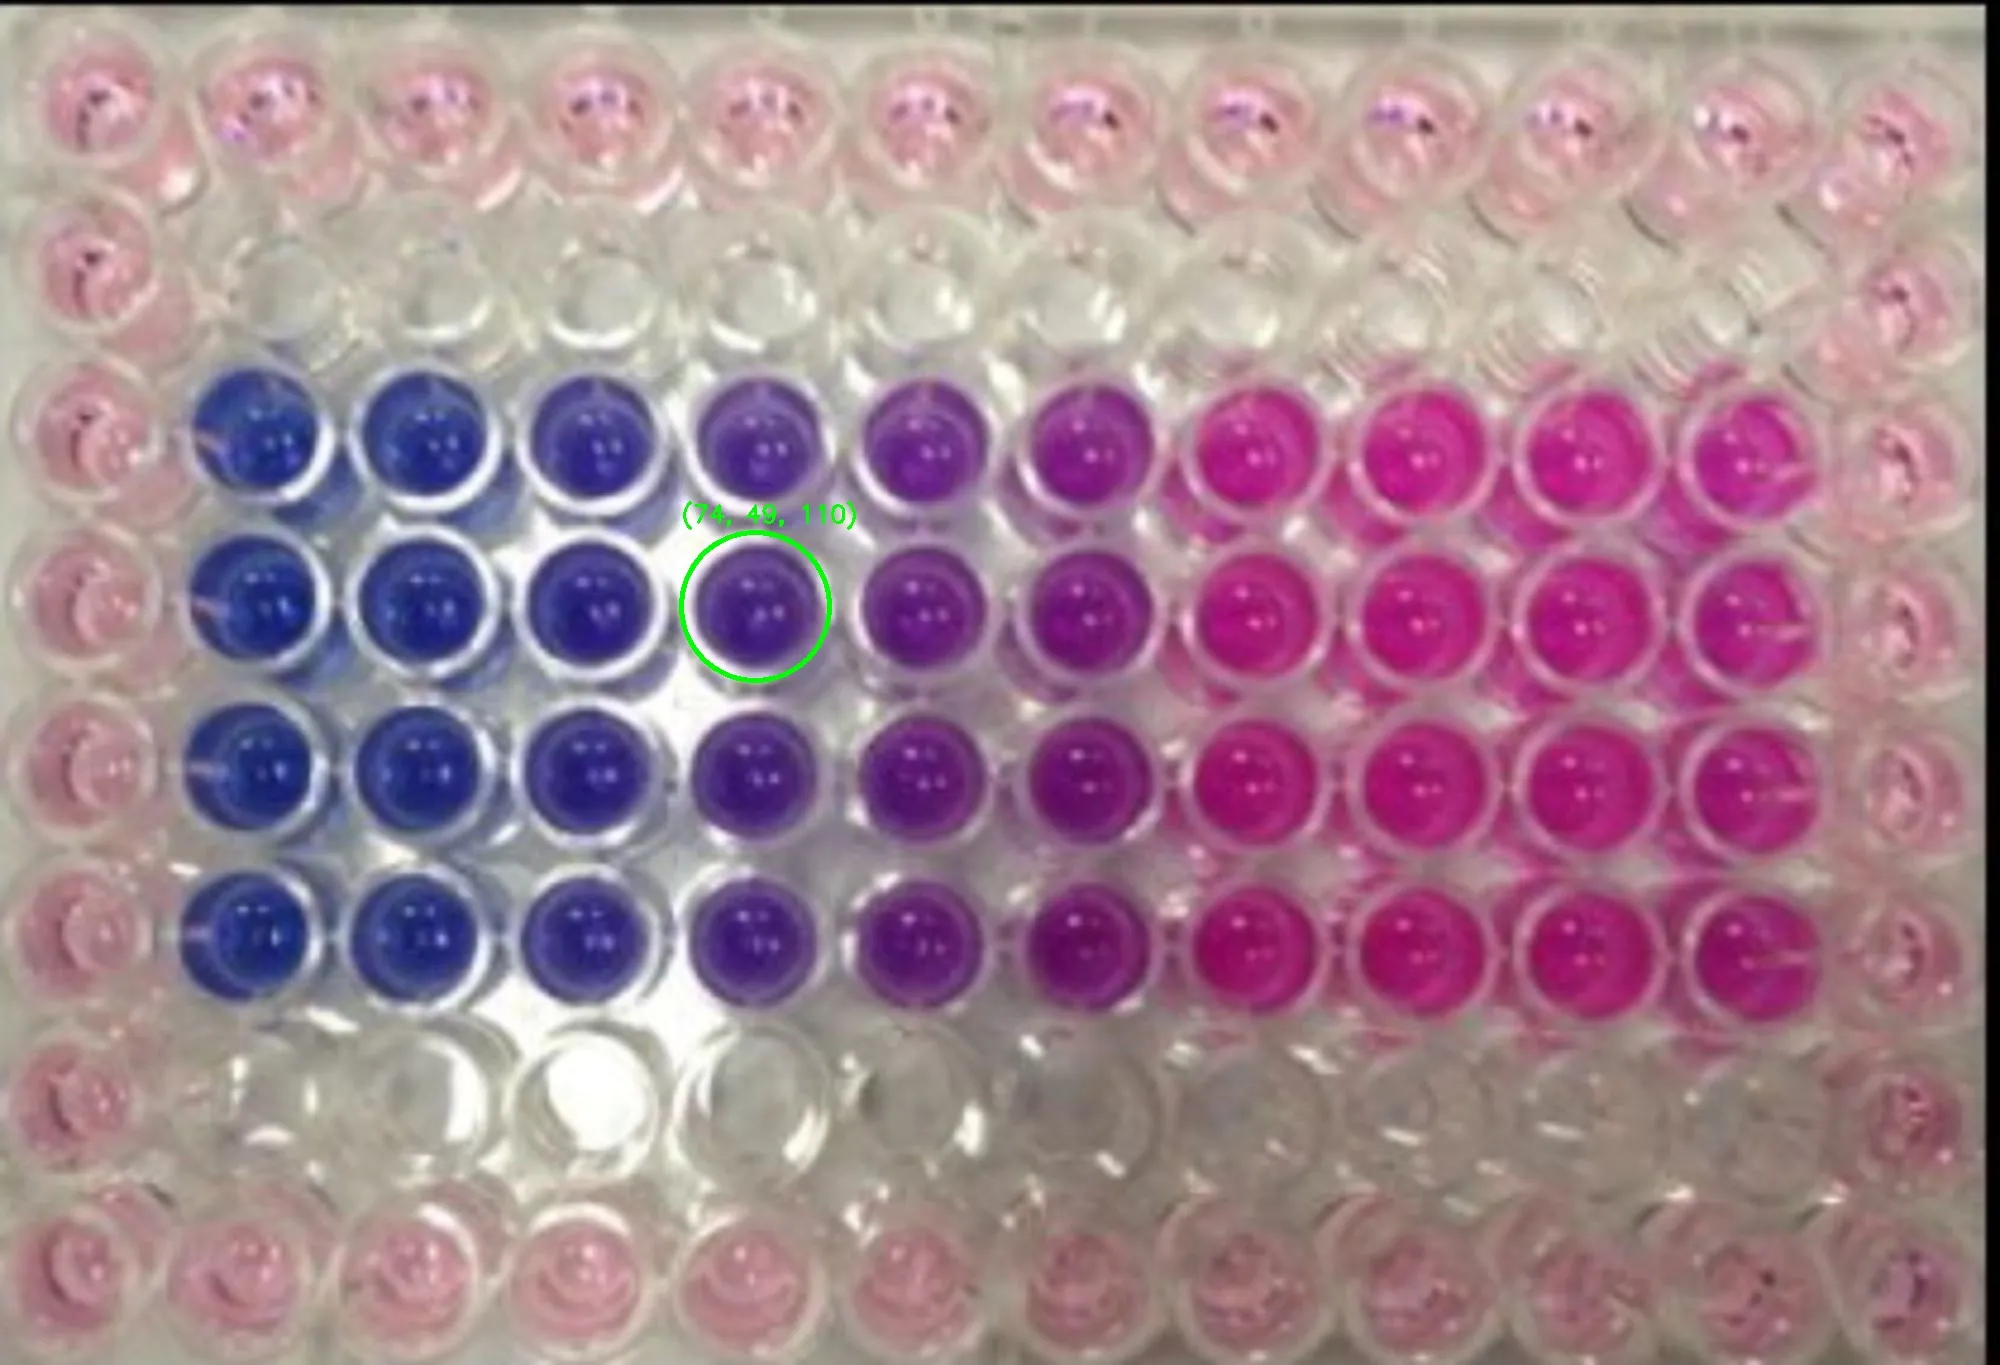
enter image description here

这是一个96孔板。我需要找到所有的孔,并返回每个孔的RGB值。粉色表示所有细胞都活着,蓝色表示没有细胞存活。他们有一个公式用于计算。现在我一直在使用这张图片,到目前为止,我可以使用以下代码检测出所有的孔:
import cv2 
import numpy as np 

# Read image. 
img = cv2.imread('images/placaTeoricaCompleta_result.jpg') 

# Convert to grayscale. 
gray = cv2.cvtColor(img, cv2.COLOR_BGR2GRAY) 

# Blur using 3 * 3 kernel. 
gray_blurred = cv2.blur(gray, (3, 3))


# Apply Hough transform on the blurred image. 
detected_circles = cv2.HoughCircles(gray_blurred, 
                cv2.HOUGH_GRADIENT, 1.2, 20, param1 = 50, 
            param2 = 30, minRadius = 30, maxRadius = 50) 

# Draw circles that are detected. 
if detected_circles is not None: 

    # Convert the circle parameters a, b and r to integers. 
    detected_circles = np.uint16(np.around(detected_circles))

    for pt in detected_circles[0, :]: 
        a, b, r = pt[0], pt[1], pt[2] 

        # Draw the circumference of the circle. 
        cv2.circle(img, (a, b), r, (0, 255, 0), 2) 

        # Draw a small circle (of radius 1) to show the center. 
        cv2.circle(img, (a, b), 1, (0, 0, 255), 3) 
    
    cv2.imshow("Detected Circle", img) 
    cv2.waitKey(0) 

但我找不到一种方法来返回每个井的RGB值。
一个真实的图像可能看起来像这样:

enter image description here

我该如何返回每个圆的RGB值?最好按照A到H和1到12的顺序排列,或者将RGB值写在圆内。

你已经得到了每个圆心,可以对圆心及其附近的RGB值进行平均处理,以获取颜色的良好测量结果。 - Cris Luengo
我建议使用不同的颜色空间,因为数字图像中物体颜色的R、G和B分量都与物体受到的光线数量以及彼此相关,因此使用这些分量来描述图像会使物体区分变得困难。使用色相/亮度/色度或色相/亮度/饱和度等方面的描述通常更为相关。这是在数字图像中检测颜色时需要考虑的,就像您发布的第二张图片一样。 - Rick M.
你看过《如何使用OpenCV在Python中找到图像的平均颜色?》吗?(链接:https://dev59.com/ZVgQ5IYBdhLWcg3wORVJ#58177484) - coffeewin
1个回答

4
您可以为每个圆生成一个掩膜,然后获取颜色通道的平均值。以下代码仅适用于一个圆,但您可以将其放入for循环中:
x, y, r = detected_circles[0].astype(np.int32)
roi = image[y - r: y + r, x - r: x + r]

region of interest

# generate mask
width, height = roi.shape[:2]
mask = np.zeros((width, height, 3), roi.dtype)
cv2.circle(mask, (int(width / 2), int(height / 2)), r, (255, 255, 255), -1)

mask

dst = cv2.bitwise_and(roi, mask)

masked image

# filter black color and fetch color values
data = []
for i in range(3):
    channel = dst[:, :, i]
    indices = np.where(channel != 0)[0]
    color = np.mean(channel[indices])
    data.append(int(color))

# opencv images are in bgr format
blue, green, red = data # (110, 74, 49)

最终图片

图中的文本采用RGB格式。


网页内容由stack overflow 提供, 点击上面的
可以查看英文原文,
原文链接