我对 Cartopy 渲染 Google 地图瓦片的结果感到有些困惑。与标准的 Google 地图相比,地图看起来非常差。
示例(代码来源于 https://ocefpaf.github.io/python4oceanographers/blog/2015/06/22/osm/):
import matplotlib.pyplot as plt

import cartopy.crs as ccrs
from cartopy.io import shapereader
from cartopy.mpl.gridliner import LONGITUDE_FORMATTER, LATITUDE_FORMATTER

def make_map(projection=ccrs.PlateCarree()):
    fig, ax = plt.subplots(figsize=(9, 13),
                           subplot_kw=dict(projection=projection))
    gl = ax.gridlines(draw_labels=True)
    gl.xlabels_top = gl.ylabels_right = False
    gl.xformatter = LONGITUDE_FORMATTER
    gl.yformatter = LATITUDE_FORMATTER
    return fig, ax
import cartopy.io.img_tiles as cimgt

extent = [-39, -38.25, -13.25, -12.5]

request = cimgt.GoogleTiles()

fig, ax = make_map(projection=request.crs)
ax.set_extent(extent)

ax.add_image(request, 10)
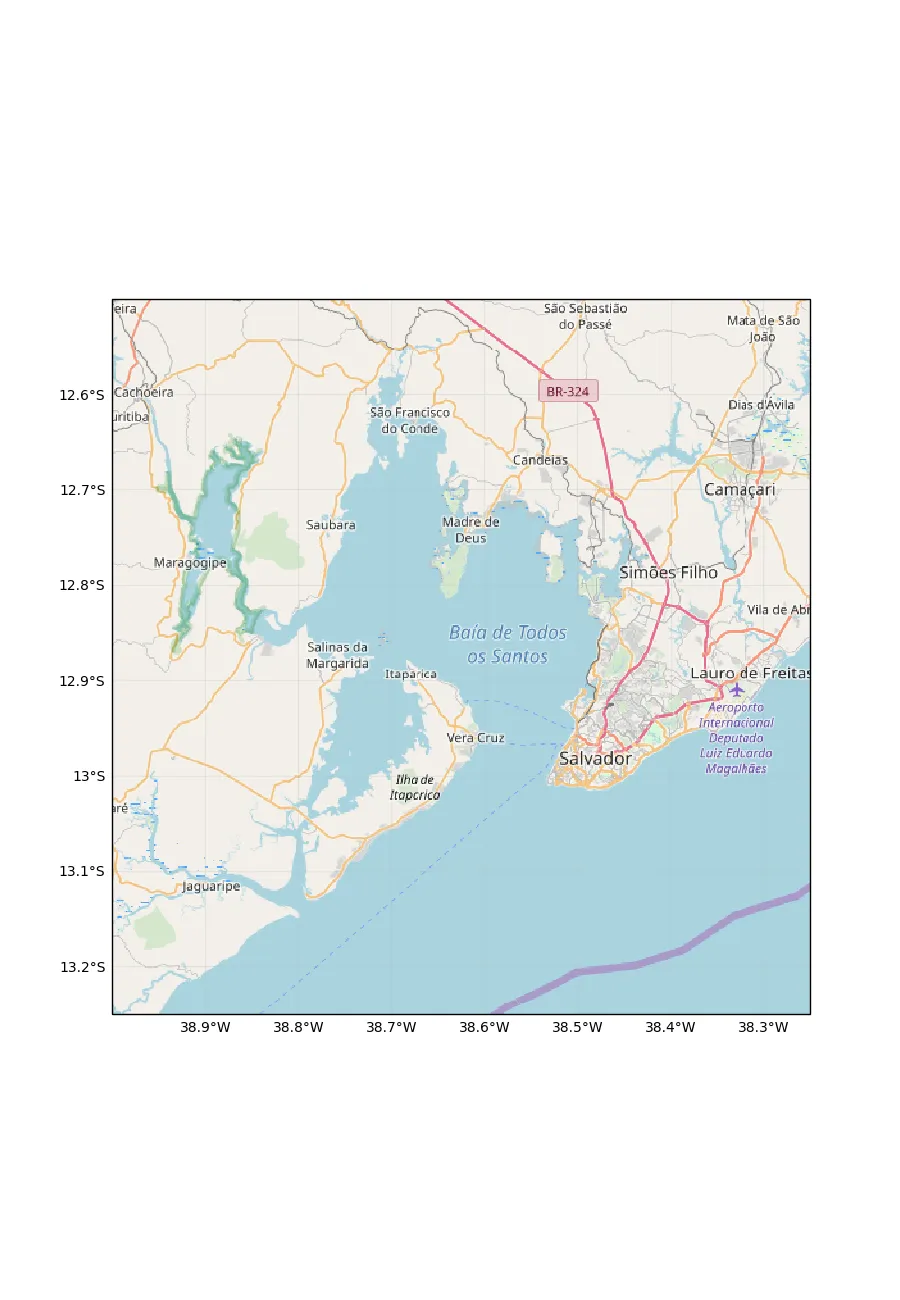
生成的图片如下:
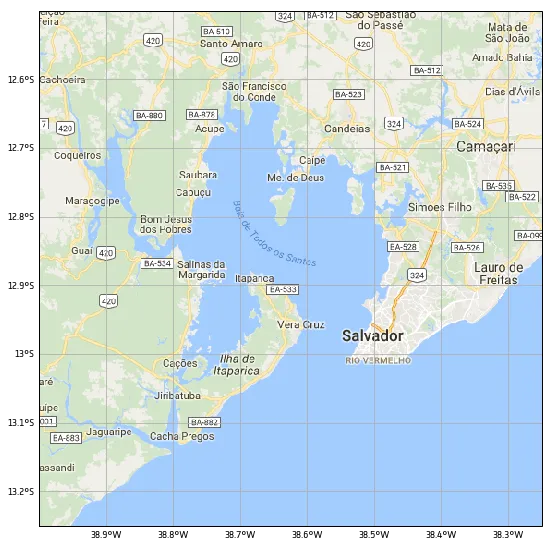
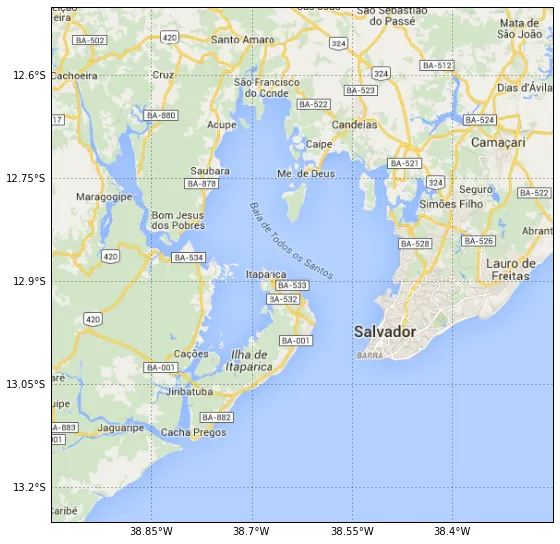
与相同图片在链接网站上的显示效果相比,看起来非常模糊——请注意标签和街道号码的像素化呈现:
更改缩放级别似乎没有改善情况。
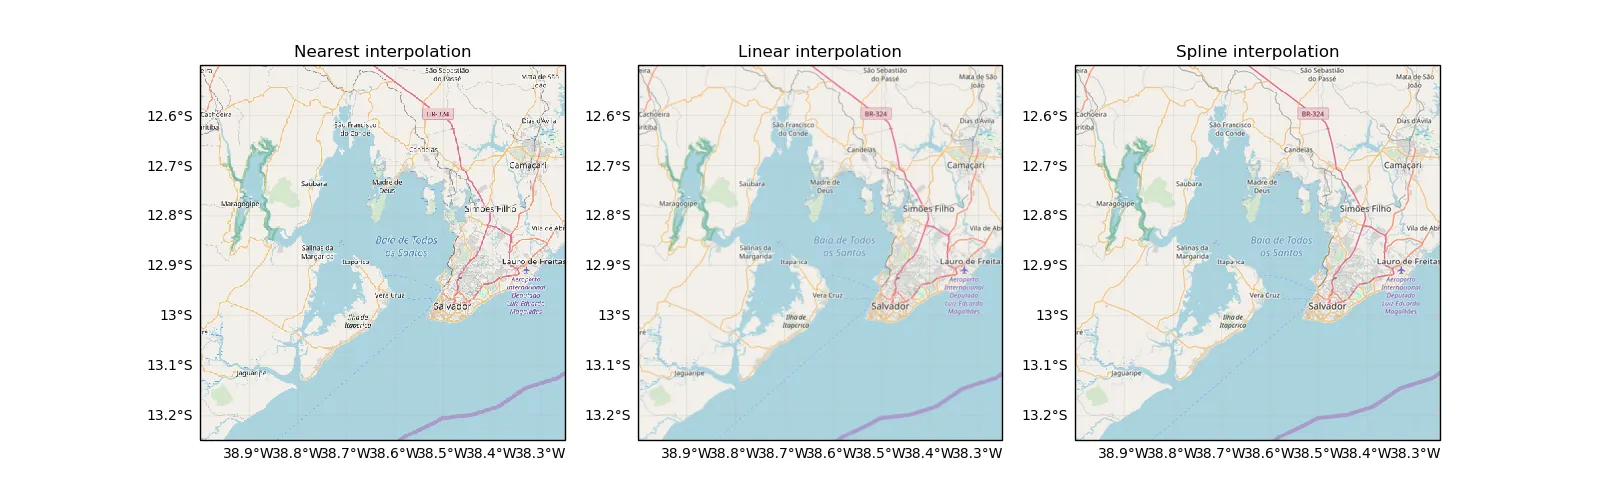
这是我正在使用Cartopy和googletiles()处理的另一个地图示例:
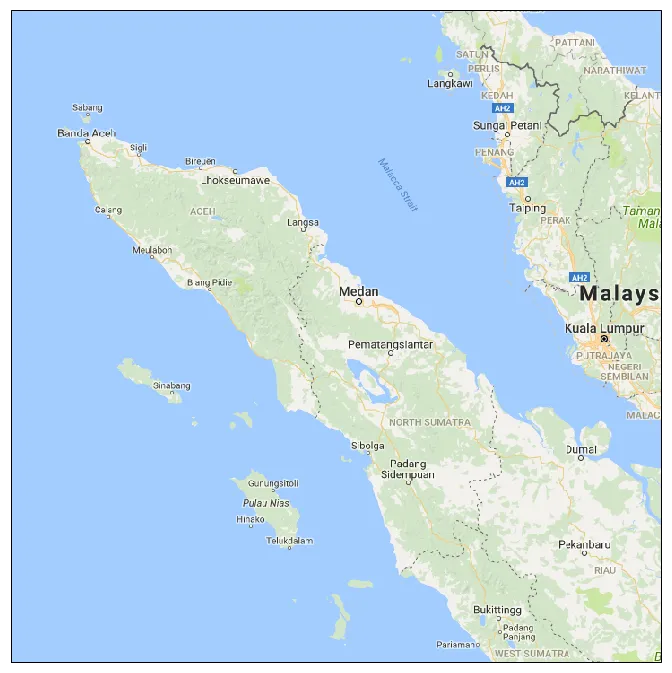
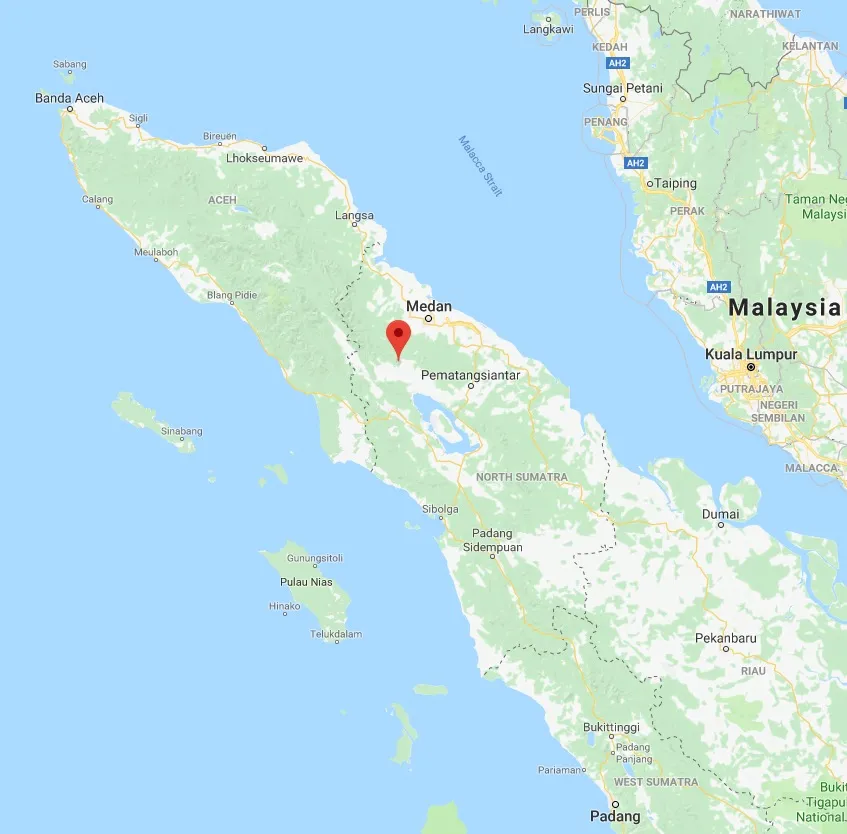
相同的地图在Google Maps中显示结果如下:
有人知道这个奇怪问题的原因以及如何解决吗?


matplotlib.get_backend()返回什么? - Daniel Kirkham