我有一些使用颜色比例尺绘制的图像数据。我想从图像中选择一条线,并在ggplot2中绘制曲线,使用相同的颜色比例尺对曲线进行着色,就像在图像中一样。这是可能的吗?
假设我将我的图像绘制如下所示:
require(ggplot2)
n <- 100 # number of observations
cols <- topo.colors(256) # color scheme
lim <- c(-10, 10) # limits corresponding to color scheme

x <- seq(0, 1, length = n) # x-axis
y <- cumsum(rnorm(n)) # Brownian motion

dat <- data.frame(x, y) # data

# Plot
ggplot(dat, aes(x, y)) + geom_line() + scale_y_continuous(limits = lim)

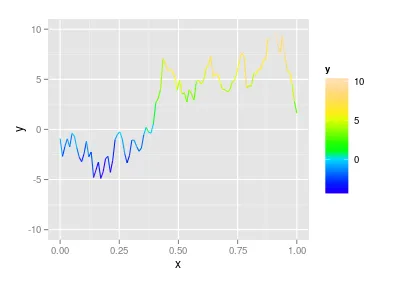
我想要将线条的颜色与以下图表类似

使用以下代码创建
colscale <- function(y, cols, ylim) {
    k <- length(cols)
    steps <- seq(ylim[1], ylim[2], length = k)

    result <- sapply(y, function(x) {cols[which.min(abs(x - steps))]})
    return(result)
}

plot(x, y, ylim = lim, col = colscale(y, cols, lim))