我目前正在使用Oxyplot和演示样例进行测试(可以在此处下载:https://github.com/oxyplot/oxyplot/archive/develop.zip),特别是样例“ColumnSeriesDemo”。
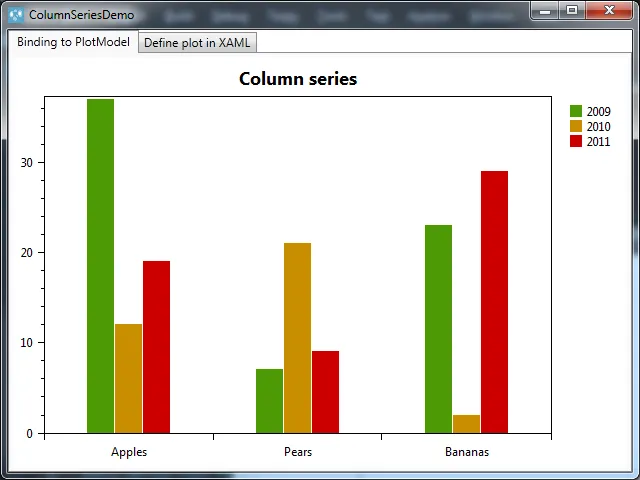
这是执行时的样子:
代码:
public MainWindow()
{
    this.InitializeComponent();

    // Create some data
    this.Items = new Collection<Item>
    {
        new Item {Label = "Apples", Value1 = 37, Value2 = 12, Value3 = 19},
        new Item {Label = "Pears", Value1 = 7, Value2 = 21, Value3 = 9},
        new Item {Label = "Bananas", Value1 = 23, Value2 = 2, Value3 = 29}
    };

    // Create the plot model
    var tmp = new PlotModel { Title = "Column series", LegendPlacement = LegendPlacement.Outside, LegendPosition = LegendPosition.RightTop, LegendOrientation = LegendOrientation.Vertical };

    // Add the axes, note that MinimumPadding and AbsoluteMinimum should be set on the value axis.
    tmp.Axes.Add(new CategoryAxis { ItemsSource = this.Items, LabelField = "Label" });
    tmp.Axes.Add(new LinearAxis { Position = AxisPosition.Left, MinimumPadding = 0, AbsoluteMinimum = 0 });

    // Add the series, note that the BarSeries are using the same ItemsSource as the CategoryAxis.
    tmp.Series.Add(new ColumnSeries { Title = "2009", ItemsSource = this.Items, ValueField = "Value1" });
    tmp.Series.Add(new ColumnSeries { Title = "2010", ItemsSource = this.Items, ValueField = "Value2" });
    tmp.Series.Add(new ColumnSeries { Title = "2011", ItemsSource = this.Items, ValueField = "Value3" });

    this.Model1 = tmp;

    this.DataContext = this;
}
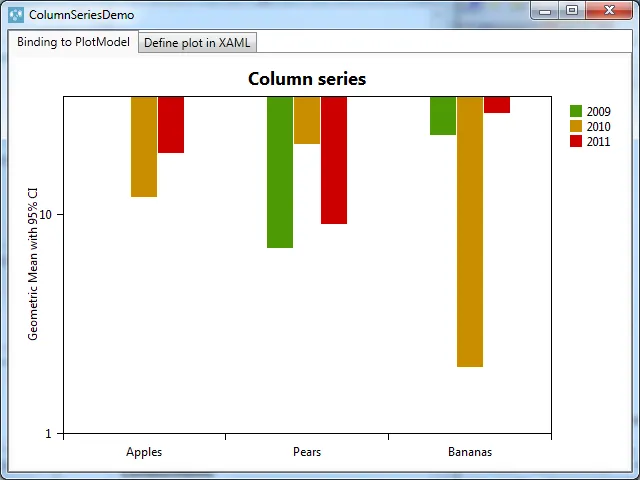
我希望有一个对数纵轴。
在上面的代码中,我将第二个坐标轴的声明从
tmp.Axes.Add(new LinearAxis { Position = AxisPosition.Left, MinimumPadding = 0, AbsoluteMinimum = 0 });
To
tmp.Axes.Add(new LogarithmicAxis { MinorTickSize = 0, Minimum = 1, Maximum = 35, Title = "Log Axis", Position = AxisPosition.Left, Base = 10, TickStyle = TickStyle.Outside });
然而,执行代码后的结果如下所示: