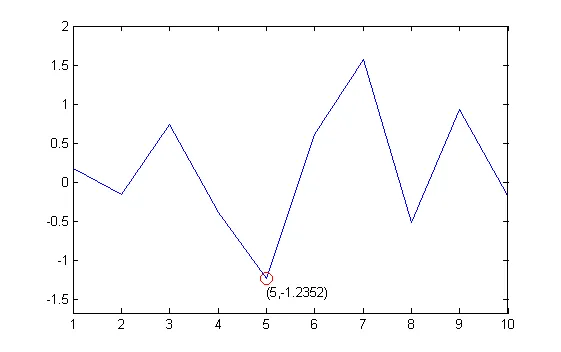
我有一条曲线,其中最低点肉眼不易辨认。因此,我希望使用标记突出显示最低点。
理想情况下,我希望在图形上用标记突出显示这一点,并同时在文本中显示其坐标。
我有一条曲线,其中最低点肉眼不易辨认。因此,我希望使用标记突出显示最低点。
理想情况下,我希望在图形上用标记突出显示这一点,并同时在文本中显示其坐标。
%// Example plot
x = 1:10;
y = randn(1,10);
plot(x,y)

%// Marker at minimum
[ymin imin] = min(y);
xmin = x(imin);
hold on
style = 'ro'; %// red circle. Change as needed
markersize = 10; %// change as needed
plot(x(imin), ymin, style, 'markersize', markersize)

%// Text with coordinates of minimum
offset = -.05; %// vertical offset as a fraction of y-axis span. Change as needed.
text(x(imin),ymin+diff(ylim)*offset,['(' num2str(x(imin)) ',' num2str(ymin) ')'])

%// Enlarge y axis so that text is properly seen, if offset is negative
ylim(ylim+[diff(ylim)*offset*(offset<0) 0])
xlim 实现。
hold on; % add things to the current figure
plot(x_coord, y_coord, '+r')
假设您有像y和x这样的数据,此代码将绘制最小点。
plot(x(y==min(y)),min(y),'o')
根据您的需求,添加文本可能有些棘手,但至少这些是坐标。