我想要有两个面板,左侧显示一个图形和两个定位器,右侧显示在由定位器定义的区域内放大的版本。
我尝试过:
ClearAll[mndpt];
mndpt = Compile[{{c, _Complex}, {maxiter, _Integer}},
   Module[{z, iters},
        iters = 0.;
        z = c;
            While[(iters < maxiter) && (Abs@z < 2),
                iters++;
                z = z^2 + c];
        Sqrt[iters/maxiter]],
   {{z, _Complex}},
   CompilationTarget \[Rule] "C",
   RuntimeOptions \[Rule] "Speed"];
并执行
Manipulate[
 Grid[
  {{DensityPlot[mndpt[x + y*I, 200],
        {x, -2, 1}, {y, -1.5, 1.5},
        PlotRange \[Rule] {0, 1}, PlotPoints \[Rule] 80,
     ColorFunction \[Rule] "Rainbow"],
    DensityPlot[mndpt[x + y*I, 200],
        Dynamic@{x, p1[[1]], p2[[1]]}, Dynamic@{y, p1[[2]], p2[[2]]},
        PlotRange \[Rule] {0, 1}, PlotPoints \[Rule] 80,
     ColorFunction \[Rule] "Rainbow"]}}],
 {{p1, {-1, -1}}, Locator}, {{p2, {0, 1}}, Locator}]
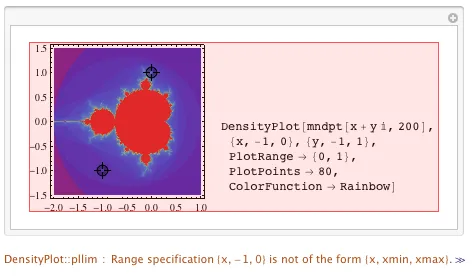 我的问题是,为什么会这样?如您所见,它抱怨" DensityPlot::pllim: Range specification {x,-1,0} is not of the form {x, xmin, xmax}。",这让我感到困惑。实际上,我一直感到困惑。发生了什么?一些范围问题?评估问题?我该如何解决?这可能很简单,但我从来没有真正理解过这个前端东西。
编辑:事实证明,这个问题是由于我自己愚蠢的短暂增加而引起的。正如Simon在评论中指出的那样,删除我盲目添加的两个
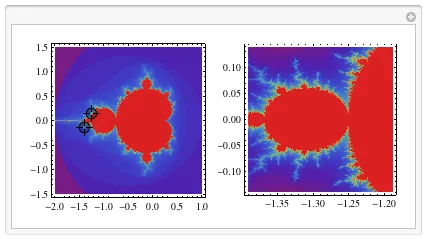
Dynamics(以使其正常工作)可以使一切正常。也就是说, Manipulate[
Grid[
{{DensityPlot[mndpt[x + y*I, 200],
{x, -2, 1}, {y, -1.5, 1.5},
PlotRange \[Rule] {0, 1}, PlotPoints \[Rule] 80,
ColorFunction \[Rule] "Rainbow"],
DensityPlot[mndpt[x + y*I, 200],
{x, p1[[1]], p2[[1]]},{y, p1[[2]], p2[[2]]},
PlotRange \[Rule] {0, 1}, PlotPoints \[Rule] 80,
ColorFunction \[Rule] "Rainbow"]}}],
{{p1, {-1, -1}}, Locator}, {{p2, {0, 1}}, Locator}]
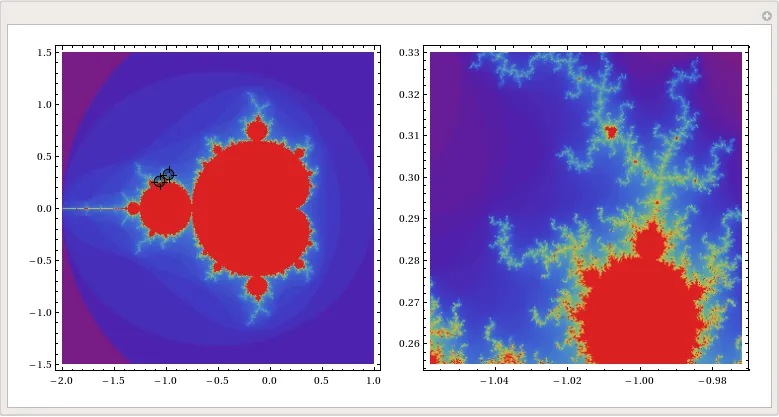
做了正确的事情:
那么,谁知道为什么前几次我做的时候它没起作用。
另一方面,在原始情况下的消息,即“DensityPlot :: pllim:范围说明{x,-1,0}不是{x,xmin,xmax}的形式。”更加令人费解。我想Leonid已经在评论中解释过(简而言之,请尝试ClearAttributes [Dynamic,ReadProtected]然后 ?? Dynamic ,你会看到有一个定义 Dynamic /:MakeBoxes [ BoxForm`x $ _ Dynamic,StandardForm]:= 等)。由于我的前端编程理解很少,因此我不会在这里尝试解释它,所以如果有人发表回答来解释它,那将不胜感激。
Dynamic,一切就能正常运行。 - SimonDynamic为何会弄乱它的想法,我想知道。 - aclDynamic(和许多其他命令一样)通过UpValues重新定义了MakeBoxes(一旦从Dynamic中删除ReadProtected属性,您就可以看到它们)。这应该会影响使用和错误消息。 - Leonid Shifrin